Understanding Retracement in Trading: A Comprehensive Guide
In the dynamic world of financial markets, understanding price movements is crucial for making informed trading decisions. Among these movements, retracement in trading stands out as a significant concept. A retracement is a temporary price reversal within a larger trend. It’s essentially a pullback before the price continues in its original direction. This guide aims to provide a comprehensive overview of retracement, its identification, and how traders can effectively use it in their strategies.
What is Retracement?
A retracement, sometimes referred to as a pullback or correction, occurs when the price of an asset moves against the prevailing trend. Imagine a stock price steadily climbing; a retracement would be a temporary dip in that price before it resumes its upward trajectory. These pullbacks are common and are often caused by profit-taking, news events, or simple market fluctuations. Recognizing these retracements is key to successful trading.
It’s important to distinguish a retracement from a reversal. A retracement is a short-term move against the trend, while a reversal indicates a more significant change in the direction of the market. Confusing the two can lead to costly trading errors.
Identifying Retracements
Several tools and techniques can help traders identify potential retracement levels:
Fibonacci Retracement Levels
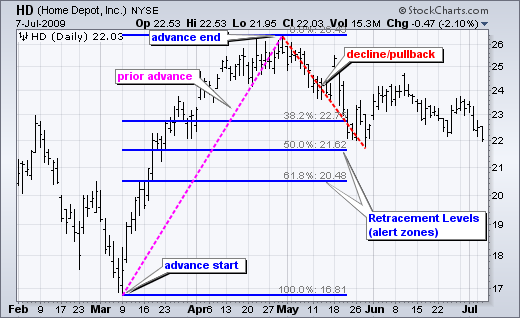
Fibonacci retracement levels are horizontal lines on a price chart that indicate areas of support or resistance. They are based on the Fibonacci sequence, a mathematical sequence where each number is the sum of the two preceding ones (e.g., 0, 1, 1, 2, 3, 5, 8, 13…). The key Fibonacci ratios used in trading are 23.6%, 38.2%, 50%, 61.8%, and 78.6%.
To use Fibonacci retracement, identify a significant high and low on a price chart. The tool will then automatically draw the Fibonacci levels between those two points. Traders often look for price to stall or reverse at these levels, indicating a potential retracement point. [See also: How to Use Fibonacci Retracements Effectively]
Support and Resistance Levels
Support and resistance levels are price points where the price has previously struggled to move beyond. Support is a price level where the price tends to bounce up, while resistance is a price level where the price tends to bounce down. These levels can act as potential retracement areas. If a price is trending upwards and encounters a resistance level, it may retrace back to a support level before continuing its upward trend.
Trendlines
Trendlines are lines drawn on a price chart to connect a series of highs or lows. In an uptrend, a trendline is drawn connecting a series of higher lows. In a downtrend, a trendline is drawn connecting a series of lower highs. When the price retraces to a trendline, it can act as a support or resistance level, potentially signaling a continuation of the trend. [See also: Mastering Trendline Trading Strategies]
Moving Averages
Moving averages smooth out price data by calculating the average price over a specific period. Common moving average periods include 50-day, 100-day, and 200-day. When the price retraces to a moving average, it can act as a dynamic support or resistance level. For instance, in an uptrend, the price might retrace to the 50-day moving average before resuming its upward climb.
Trading Strategies Using Retracement
Once you can identify potential retracement levels, you can incorporate them into your trading strategies:
Buying the Dip (Long Positions)
In an uptrend, traders often look to “buy the dip,” which means buying when the price retraces to a support level or Fibonacci level. The idea is to enter a long position at a lower price, anticipating that the price will resume its upward trend. For example, if a stock is trending upwards and retraces to the 38.2% Fibonacci level, a trader might buy the stock, placing a stop-loss order below the retracement level to limit potential losses.
Selling the Rally (Short Positions)
In a downtrend, traders often look to “sell the rally,” which means selling when the price retraces to a resistance level or Fibonacci level. The idea is to enter a short position at a higher price, anticipating that the price will resume its downward trend. For example, if a stock is trending downwards and retraces to the 61.8% Fibonacci level, a trader might sell the stock short, placing a stop-loss order above the retracement level.
Combining Retracement with Other Indicators
To increase the probability of successful trades, it’s often beneficial to combine retracement analysis with other technical indicators. For example, you could use the Relative Strength Index (RSI) to confirm overbought or oversold conditions at retracement levels. If the price retraces to a Fibonacci level and the RSI indicates an oversold condition, it could be a stronger signal to buy the dip. Similarly, you could use moving average convergence divergence (MACD) to confirm the momentum of the trend following the retracement.
Risks and Considerations
While retracement trading can be profitable, it’s essential to be aware of the risks involved:
False Signals
Not all retracements are created equal. Sometimes, a retracement can turn into a full-blown reversal. It’s crucial to use stop-loss orders to limit potential losses if the price breaks through the retracement level. Additionally, confirming the retracement with other indicators can help filter out false signals.
Market Volatility
High market volatility can make it difficult to identify and trade retracements accurately. During volatile periods, prices can fluctuate wildly, leading to false breakouts and stop-loss triggers. It’s generally advisable to reduce your position size or avoid trading altogether during periods of high volatility. [See also: Managing Risk in Volatile Markets]
Over-reliance on Indicators
Relying solely on retracement indicators without considering other factors, such as fundamental analysis and market sentiment, can be detrimental. It’s essential to have a holistic view of the market and consider all relevant information before making trading decisions.
Examples of Retracement in Action
Let’s consider a hypothetical example. Suppose a tech stock, XYZ, is in a strong uptrend, trading at $100. The stock then retraces to $90, which coincides with the 38.2% Fibonacci level. A trader, using this information, could enter a long position at $90, placing a stop-loss order at $88. If the stock resumes its uptrend, the trader could profit from the price increase. However, if the stock breaks below $88, the stop-loss order would be triggered, limiting the trader’s losses.
Another example could be a currency pair, such as EUR/USD, in a downtrend. The pair is trading at 1.1000 and then retraces to 1.1100, which aligns with a previous resistance level. A trader might enter a short position at 1.1100, placing a stop-loss order at 1.1150. If the currency pair resumes its downtrend, the trader could profit from the price decrease. However, if the pair breaks above 1.1150, the stop-loss order would be triggered.
Conclusion
Retracement in trading is a valuable concept that can help traders identify potential entry and exit points in the market. By understanding how to identify retracements using tools like Fibonacci levels, support and resistance, trendlines, and moving averages, traders can develop effective strategies for buying the dip or selling the rally. However, it’s crucial to be aware of the risks involved and to use stop-loss orders to limit potential losses. Combining retracement analysis with other technical indicators and fundamental analysis can further enhance the probability of successful trades. Always remember that successful trading requires a combination of knowledge, discipline, and risk management.
