
Understanding Retracement in Trading: A Comprehensive Guide
In the dynamic world of financial markets, understanding price movements is crucial for successful trading. One such movement, known as a retracement, offers valuable insights into potential trading opportunities. This guide delves into the intricacies of retracement in trading, providing a comprehensive overview for both novice and experienced traders. A retracement is a temporary price reversal within a larger trend. Identifying and understanding retracements can significantly improve trading strategies and risk management. This article will explore what retracements are, how to identify them, common retracement levels, and strategies for trading them effectively. We will also discuss the tools and indicators that can help traders analyze and capitalize on retracement opportunities.
What is a Retracement?
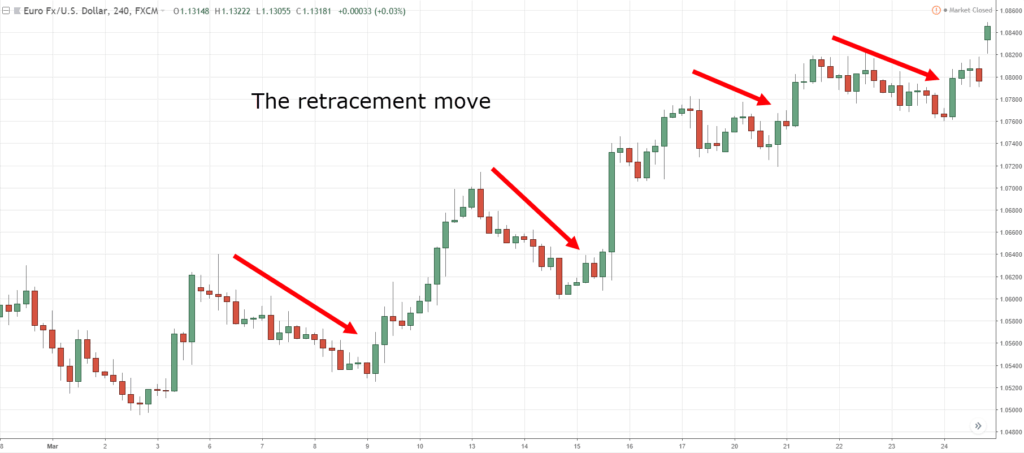
A retracement is a short-term price movement that goes against the prevailing trend. It is often viewed as a temporary dip or rally before the price resumes its original direction. Think of it like a brief pause or pullback in a larger, ongoing journey. Retracements are natural occurrences in the market and are driven by various factors, including profit-taking, news events, and changes in market sentiment. It’s important to distinguish a retracement from a reversal, where the price trend changes direction permanently.
Retracement vs. Reversal
While both retracements and reversals involve price movements against the current trend, they are fundamentally different. A retracement is a temporary correction, while a reversal indicates a change in the overall trend. Confusing the two can lead to costly trading errors. To differentiate, traders often look for confirmation signals, such as volume, momentum indicators, and chart patterns. A retracement typically sees a continuation of the original trend after the pullback, whereas a reversal signals a more sustained change in market direction.
Identifying Retracements
Identifying retracements accurately is key to leveraging them for profitable trades. Several tools and techniques can assist in this process. Chart patterns, Fibonacci levels, and technical indicators are among the most commonly used methods.
Chart Patterns
Certain chart patterns can signal potential retracements. For example, flags and pennants are continuation patterns that often appear during retracements. These patterns typically form after a strong price movement and represent a period of consolidation before the price continues in its original direction. Recognizing these patterns can provide early indications of a retracement and potential entry points for trades.
Fibonacci Retracement Levels
Fibonacci retracement levels are horizontal lines drawn on a chart to indicate potential levels of support or resistance where the price might reverse during a retracement. These levels are based on the Fibonacci sequence and are commonly used by traders to identify potential entry and exit points. The most popular Fibonacci retracement levels are 23.6%, 38.2%, 50%, 61.8%, and 78.6%. Traders often look for price to react at these levels, providing opportunities to enter trades in the direction of the original trend.
Technical Indicators
Various technical indicators can help identify retracements. Moving averages, Relative Strength Index (RSI), and Moving Average Convergence Divergence (MACD) are among the most popular. For example, a crossover of two moving averages can signal the end of a retracement and the resumption of the original trend. Similarly, RSI can indicate overbought or oversold conditions during a retracement, suggesting a potential reversal. MACD can also provide signals through its histogram and signal line crossovers.
Common Retracement Levels
Understanding common retracement levels is crucial for anticipating potential price movements. These levels act as potential support or resistance areas where the price might pause or reverse during a retracement. The most widely used retracement levels are based on the Fibonacci sequence.
Fibonacci Ratios
As mentioned earlier, Fibonacci ratios play a significant role in identifying potential retracement levels. The 38.2%, 50%, and 61.8% levels are the most commonly watched. The 50% level is often seen as a psychological level where traders expect a significant reaction. Many traders use these levels in conjunction with other technical indicators to confirm potential retracement entry points. The 61.8% level, also known as the “golden ratio,” is particularly significant and often acts as a strong support or resistance level.
Support and Resistance
Identifying existing support and resistance levels can also aid in predicting potential retracement endpoints. These levels represent areas where the price has previously struggled to move beyond. During a retracement, the price may find support at a previous resistance level or encounter resistance at a previous support level. Combining Fibonacci levels with existing support and resistance zones can provide a more robust confirmation of potential retracement entry points. [See also: Understanding Support and Resistance Levels in Trading]
Strategies for Trading Retracements
Trading retracements effectively requires a well-defined strategy that includes entry and exit points, stop-loss orders, and risk management. Several strategies can be employed, depending on the trader’s risk tolerance and trading style.
Trend Following
One common strategy is to trade in the direction of the overall trend. This involves identifying a strong trend and waiting for a retracement to occur. Once the price reaches a potential support or resistance level (identified using Fibonacci levels or other technical indicators), traders can enter a trade in the direction of the trend. Stop-loss orders should be placed below the support level (for long trades) or above the resistance level (for short trades) to limit potential losses. This strategy is suitable for traders who are comfortable with a higher probability of success but potentially lower reward-to-risk ratio.
Counter-Trend Trading
Another strategy is to trade against the trend during a retracement. This involves identifying potential reversal points and entering trades in the opposite direction of the prevailing trend. This strategy is riskier than trend following but can offer higher potential rewards. Traders using this strategy often look for overbought or oversold conditions (using indicators like RSI) to identify potential reversal points. Stop-loss orders should be placed carefully to avoid being triggered by minor price fluctuations.
Confirmation Signals
Regardless of the strategy employed, it is crucial to wait for confirmation signals before entering a trade. These signals can include candlestick patterns, such as engulfing patterns or pin bars, or confirmation from other technical indicators. Waiting for confirmation can help reduce the risk of entering a trade prematurely and increase the probability of success. [See also: Candlestick Patterns for Day Trading]
Tools and Indicators for Retracement Analysis
Several tools and indicators can assist traders in analyzing and capitalizing on retracement opportunities. These tools can help identify potential retracement levels, confirm entry signals, and manage risk effectively.
Fibonacci Tools
Fibonacci tools are essential for identifying potential retracement levels. Most trading platforms offer built-in Fibonacci tools that allow traders to draw retracement levels on their charts easily. These tools automatically calculate the Fibonacci ratios and display the corresponding levels on the chart.
Moving Averages
Moving averages can help identify the overall trend and potential retracement entry points. A simple moving average (SMA) or exponential moving average (EMA) can smooth out price fluctuations and provide a clearer picture of the trend. Traders often use moving averages in conjunction with other indicators to confirm potential retracement entries.
RSI and MACD
RSI and MACD are momentum indicators that can help identify overbought or oversold conditions during a retracement. RSI measures the magnitude of recent price changes to evaluate overbought or oversold conditions in the price of a stock or other asset. MACD is a trend-following momentum indicator that shows the relationship between two moving averages of a security’s price. These indicators can provide valuable insights into the strength of a retracement and potential reversal points.
Risk Management in Retracement Trading
Effective risk management is paramount when trading retracements. It’s crucial to set appropriate stop-loss orders and manage position sizes to protect capital. Without proper risk management, even the most well-planned retracement strategy can lead to significant losses.
Stop-Loss Orders
Stop-loss orders are essential for limiting potential losses. When trading retracements, stop-loss orders should be placed below the support level (for long trades) or above the resistance level (for short trades). The placement of stop-loss orders should be determined based on the trader’s risk tolerance and the volatility of the market. [See also: The Importance of Stop-Loss Orders in Trading]
Position Sizing
Position sizing is another critical aspect of risk management. Traders should only risk a small percentage of their trading capital on each trade. A common rule of thumb is to risk no more than 1-2% of trading capital on a single trade. Proper position sizing can help protect capital and prevent significant losses from a single losing trade.
Conclusion
Understanding retracement in trading is essential for navigating the complexities of financial markets. By identifying retracements, utilizing Fibonacci levels, and employing appropriate trading strategies, traders can capitalize on these temporary price movements. However, it’s crucial to remember that no trading strategy is foolproof, and effective risk management is paramount. By combining technical analysis with sound risk management practices, traders can increase their chances of success in the market. Further research and practice are always recommended to refine your understanding and skills in retracement trading.
