Unlocking Market Dynamics: A Comprehensive Guide to the Squeeze Indicator
In the fast-paced world of financial markets, traders and investors are constantly seeking tools and indicators to gain a competitive edge. One such tool that has gained popularity in recent years is the squeeze indicator. This article delves into the intricacies of the squeeze indicator, exploring its functionality, interpretation, and application in various trading strategies. Understanding the squeeze indicator can empower traders to identify potential breakout opportunities and manage risk effectively.
What is the Squeeze Indicator?
The squeeze indicator, often associated with the Bollinger Bands and Keltner Channels, is a technical analysis tool designed to identify periods of low volatility followed by potential breakouts. It essentially measures the relationship between volatility and price consolidation. When volatility is low, the Bollinger Bands tend to squeeze inside the Keltner Channels, signaling a period of consolidation. This “squeeze” suggests that pent-up energy is building in the market, and a significant price move is likely to occur.
The indicator was popularized by John Carter of Simpler Trading, who uses it as part of his trading strategy. He further refined the indicator, incorporating elements to enhance its accuracy and usability.
Understanding the Components
To fully grasp the squeeze indicator, it’s crucial to understand its underlying components:
- Bollinger Bands: These bands are plotted at standard deviation levels above and below a simple moving average (SMA) of the price. They expand and contract with volatility.
- Keltner Channels: These channels are plotted at a certain average true range (ATR) level above and below an exponential moving average (EMA) of the price. They also expand and contract with volatility, but their calculation is based on ATR.
The squeeze indicator identifies a “squeeze” when the Bollinger Bands are entirely contained within the Keltner Channels. This indicates a period of low volatility and price consolidation.
How the Squeeze Indicator Works
The squeeze indicator typically uses a histogram to visualize the “squeeze” and “release” phases. Here’s how it works:
- Squeeze On: When the Bollinger Bands are inside the Keltner Channels, the histogram is typically below the zero line. This signifies a period of low volatility and consolidation.
- Squeeze Off: When the Bollinger Bands break outside the Keltner Channels, the histogram crosses above the zero line. This indicates the “release” of the squeeze and the potential for a significant price move.
Traders often look for a specific sequence of events to confirm a potential trade setup. For example, they might wait for the histogram to cross above the zero line after a period below the zero line, indicating a potential breakout.
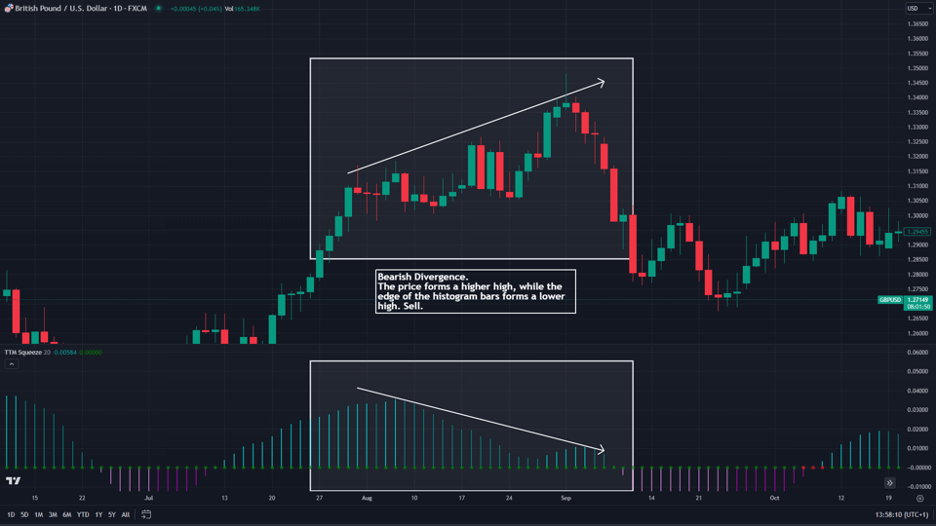
Interpreting the Squeeze Indicator
Interpreting the squeeze indicator requires careful consideration of market context and other technical indicators. Here are some key considerations:
- Direction of the Breakout: The squeeze indicator does not predict the direction of the breakout. Traders need to use other tools, such as trendlines, support and resistance levels, and price action analysis, to determine the likely direction of the price move.
- Confirmation Signals: It’s crucial to look for confirmation signals before entering a trade. These signals might include a break of a key support or resistance level, a surge in volume, or a crossover in a momentum indicator.
- Timeframe: The squeeze indicator can be used on various timeframes, from intraday charts to daily and weekly charts. The optimal timeframe will depend on the trader’s trading style and risk tolerance.
- False Signals: Like any technical indicator, the squeeze indicator can generate false signals. It’s essential to use risk management techniques, such as stop-loss orders, to protect capital.
Using the Squeeze Indicator in Trading Strategies
The squeeze indicator can be incorporated into various trading strategies. Here are a few examples:
Breakout Trading
Breakout trading involves identifying periods of consolidation followed by a breakout of a key support or resistance level. The squeeze indicator can help identify potential breakout opportunities. Traders typically wait for the histogram to cross above the zero line and then look for confirmation signals, such as a break of a trendline or a surge in volume, before entering a trade. [See also: Identifying Breakout Patterns]
Trend Following
Trend following involves identifying and riding established trends. The squeeze indicator can help identify periods of consolidation within a trend, which can provide opportunities to enter or add to a position. Traders typically look for the histogram to cross above the zero line in the direction of the trend.
Mean Reversion
Mean reversion involves identifying periods when the price has deviated significantly from its average and then betting on a return to the mean. The squeeze indicator can help identify periods of extreme volatility, which can provide opportunities for mean reversion trades. Traders typically look for the histogram to cross above the zero line after a period of extreme volatility, indicating a potential pullback.
Advantages and Disadvantages
Like any trading tool, the squeeze indicator has its advantages and disadvantages:
Advantages
- Identifies Potential Breakouts: The squeeze indicator can help traders identify potential breakout opportunities by highlighting periods of low volatility and consolidation.
- Easy to Understand: The indicator is relatively easy to understand and interpret, making it accessible to traders of all skill levels.
- Versatile: The squeeze indicator can be used on various timeframes and in various trading strategies.
Disadvantages
- Does Not Predict Direction: The squeeze indicator does not predict the direction of the breakout, requiring traders to use other tools to determine the likely direction of the price move.
- Can Generate False Signals: Like any technical indicator, the squeeze indicator can generate false signals.
- Requires Confirmation: It’s crucial to look for confirmation signals before entering a trade based on the squeeze indicator.
Customizing the Squeeze Indicator
Most charting platforms allow traders to customize the squeeze indicator to suit their individual preferences and trading styles. Some common customization options include:
- Moving Average Length: The length of the moving average used to calculate the Bollinger Bands and Keltner Channels can be adjusted.
- Standard Deviation Multiplier: The number of standard deviations used to calculate the Bollinger Bands can be adjusted.
- ATR Multiplier: The number of average true ranges used to calculate the Keltner Channels can be adjusted.
- Histogram Colors: The colors of the histogram can be customized to make it easier to identify the “squeeze” and “release” phases.
Real-World Examples
Let’s look at a couple of real-world examples of how the squeeze indicator can be used in trading:
Example 1: Breakout Trade
Imagine a stock has been trading in a tight range for several weeks. The squeeze indicator shows that the Bollinger Bands are inside the Keltner Channels, indicating a period of low volatility. Suddenly, the stock breaks above a key resistance level, and the histogram crosses above the zero line. This could be a potential breakout trade. A trader might enter a long position with a stop-loss order placed below the resistance level.
Example 2: Trend Following Trade
Imagine a stock has been in an uptrend for several months. The squeeze indicator shows that the price has been consolidating within the trend. The histogram crosses above the zero line, indicating a potential continuation of the uptrend. A trader might enter a long position with a stop-loss order placed below a recent swing low.
Conclusion
The squeeze indicator is a valuable tool for traders looking to identify potential breakout opportunities and manage risk effectively. By understanding its components, interpretation, and application in various trading strategies, traders can enhance their trading skills and improve their overall performance. However, it’s crucial to remember that the squeeze indicator is not a foolproof system and should be used in conjunction with other technical indicators and risk management techniques. Like all technical analysis tools, it is most effective when combined with a solid understanding of market fundamentals and overall economic conditions. The squeeze indicator can be a powerful addition to any trader’s toolkit, providing insights into market volatility and potential price movements.
