
Unlocking Market Insights: A Comprehensive Guide to the Squeeze Indicator
In the dynamic world of financial markets, traders and investors are constantly seeking tools and indicators to gain a competitive edge. One such tool that has gained popularity is the Squeeze Indicator. This article provides a comprehensive overview of the Squeeze Indicator, exploring its mechanics, interpretation, and practical applications in trading strategies. Understanding the Squeeze Indicator can empower traders to identify potential breakout opportunities and manage risk effectively. The Squeeze Indicator is a valuable tool for technical analysts seeking to understand market volatility and potential price movements.
Understanding Market Volatility and the Need for Indicators
Before diving into the specifics of the Squeeze Indicator, it’s crucial to understand the concept of market volatility. Volatility refers to the degree of price fluctuation in a financial market. High volatility indicates significant price swings, while low volatility suggests relatively stable prices. Traders often use volatility indicators to gauge market risk and identify potential trading opportunities.
The Squeeze Indicator is designed to identify periods of low volatility, which often precede significant price breakouts. By recognizing these ‘squeeze’ periods, traders can position themselves to capitalize on the subsequent price movement. Understanding how a Squeeze Indicator works is vital for making informed trading decisions.
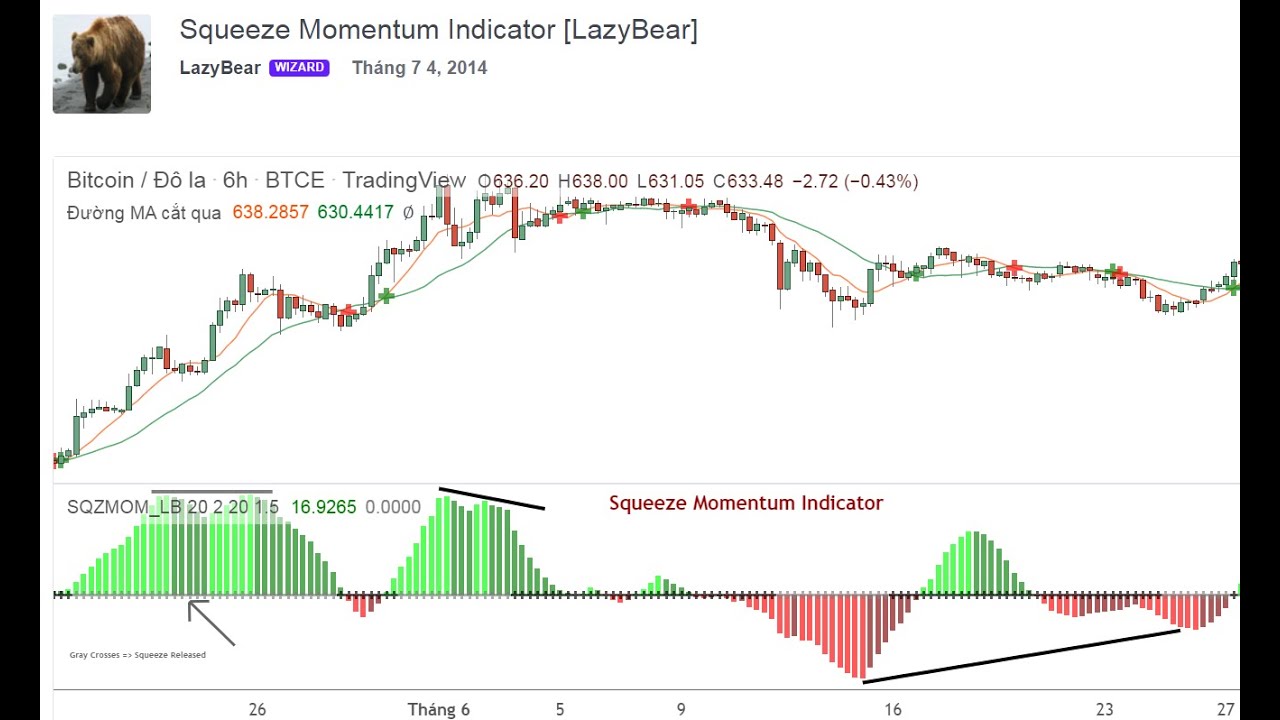
What is the Squeeze Indicator?
The Squeeze Indicator, often associated with John Carter of Simpler Trading, is a technical analysis tool that identifies periods of low volatility, suggesting a potential build-up of energy that could lead to a significant price breakout. It’s based on the relationship between Bollinger Bands and Keltner Channels. When the Bollinger Bands are completely inside the Keltner Channels, the indicator signals a ‘squeeze,’ indicating a period of consolidation and reduced volatility.
The core idea behind the Squeeze Indicator is that periods of low volatility are often followed by periods of high volatility. This is because the market tends to oscillate between periods of consolidation and expansion. The indicator helps traders identify when the market is in a consolidation phase, allowing them to prepare for the potential breakout.
The Mechanics of the Squeeze Indicator: Bollinger Bands and Keltner Channels
Bollinger Bands
Bollinger Bands consist of a simple moving average (SMA) and two bands plotted above and below the SMA. These bands are typically calculated as two standard deviations away from the SMA. They expand and contract based on market volatility. When volatility increases, the bands widen, and when volatility decreases, the bands narrow.
Keltner Channels
Keltner Channels consist of an exponential moving average (EMA) and two bands plotted above and below the EMA. These bands are typically calculated using the Average True Range (ATR). ATR measures the average price range over a specific period, providing an indication of market volatility. Keltner Channels, like Bollinger Bands, expand and contract with volatility.
The Squeeze Condition
The Squeeze Indicator identifies a ‘squeeze’ when the Bollinger Bands are entirely contained within the Keltner Channels. This condition suggests that volatility is exceptionally low, and the market is poised for a potential breakout. The tighter the squeeze, the greater the potential for a significant price movement.
Interpreting the Squeeze Indicator: Identifying Potential Breakouts
The primary purpose of the Squeeze Indicator is to identify potential breakout opportunities. When the indicator signals a squeeze, traders should be on the lookout for a breakout in either direction. The direction of the breakout can often be determined by analyzing other technical indicators and price patterns.
It’s important to note that the Squeeze Indicator does not predict the direction of the breakout. It simply indicates that a breakout is likely to occur. Traders need to use other tools and techniques to determine the potential direction of the price movement. [See also: Trend Following Strategies]
Using the Squeeze Indicator in Trading Strategies
The Squeeze Indicator can be incorporated into various trading strategies. Here are a few examples:
- Breakout Trading: When the Squeeze Indicator signals a squeeze, traders can set pending orders above and below the current price. Once the price breaks out of the range, the corresponding order will be triggered.
- Trend Following: The Squeeze Indicator can be used in conjunction with trend-following indicators to confirm potential trend reversals. If the indicator signals a squeeze after a prolonged uptrend, it could suggest a potential trend reversal to the downside.
- Range Trading: The Squeeze Indicator can also be used to identify potential range-bound markets. When the indicator consistently signals squeezes, it could indicate that the market is in a consolidation phase and is likely to remain within a defined range.
Confirming Signals with Other Technical Indicators
While the Squeeze Indicator can be a valuable tool, it’s essential to confirm its signals with other technical indicators. Relying solely on one indicator can lead to false signals and poor trading decisions. Some commonly used indicators for confirming Squeeze Indicator signals include:
- Moving Averages: Moving averages can help identify the overall trend direction.
- Relative Strength Index (RSI): RSI can help identify overbought and oversold conditions.
- Moving Average Convergence Divergence (MACD): MACD can help identify potential trend reversals.
- Volume: Volume can confirm the strength of a breakout.
Advantages and Limitations of the Squeeze Indicator
Advantages
- Identifies Potential Breakouts: The Squeeze Indicator effectively identifies periods of low volatility that often precede significant price breakouts.
- Easy to Understand: The indicator is relatively straightforward to understand and interpret.
- Versatile: The Squeeze Indicator can be incorporated into various trading strategies.
Limitations
- Does Not Predict Direction: The Squeeze Indicator does not predict the direction of the breakout.
- False Signals: The indicator can generate false signals, especially in choppy or sideways markets.
- Requires Confirmation: It’s essential to confirm Squeeze Indicator signals with other technical indicators.
Customizing the Squeeze Indicator Settings
Most trading platforms allow you to customize the settings of the Squeeze Indicator. The default settings are typically based on the standard parameters for Bollinger Bands and Keltner Channels. However, you can adjust these settings to better suit your trading style and the specific market you are trading. Some common settings that can be customized include:
- Moving Average Length: The length of the moving average used in the Bollinger Bands and Keltner Channels.
- Standard Deviation: The number of standard deviations used to calculate the Bollinger Bands.
- ATR Length: The length of the Average True Range (ATR) used in the Keltner Channels.
Experimenting with different settings can help you find the optimal parameters for your trading strategy. [See also: Technical Analysis for Beginners]
Real-World Examples of the Squeeze Indicator in Action
Let’s examine a couple of hypothetical scenarios where the Squeeze Indicator could be applied:
Example 1: A stock has been trading in a narrow range for several weeks. The Squeeze Indicator signals a squeeze. A trader notices that the stock is also forming a bullish pennant pattern. Based on this information, the trader places a buy order above the upper trendline of the pennant. The stock eventually breaks out of the pennant pattern, triggering the buy order and resulting in a profitable trade.
Example 2: A currency pair has been in a strong uptrend. The Squeeze Indicator signals a squeeze. A trader also observes a bearish divergence on the RSI. This suggests that the uptrend is losing momentum and a potential reversal is likely. The trader places a sell order below the recent swing low. The currency pair eventually reverses direction, triggering the sell order and resulting in a profitable trade.
Conclusion: Mastering the Squeeze Indicator for Enhanced Trading
The Squeeze Indicator is a powerful tool for identifying potential breakout opportunities in financial markets. By understanding its mechanics, interpretation, and limitations, traders can effectively incorporate it into their trading strategies. Remember to confirm Squeeze Indicator signals with other technical indicators and always practice proper risk management. With practice and experience, you can master the Squeeze Indicator and use it to enhance your trading performance. The ability to recognize and interpret the Squeeze Indicator is a valuable skill for any serious trader. Further research into the Squeeze Indicator can help you refine your trading approach.
