
Unlocking Market Secrets: A Deep Dive into the Momentum Squeeze Indicator
In the dynamic world of financial markets, traders and investors are constantly seeking tools and techniques to gain an edge. Among the plethora of indicators available, the momentum squeeze indicator stands out as a powerful tool for identifying potential breakout opportunities. This article provides a comprehensive exploration of the momentum squeeze indicator, its underlying principles, how it works, and how it can be effectively used in trading strategies.
Understanding Momentum and Volatility
Before delving into the specifics of the momentum squeeze indicator, it’s crucial to understand the concepts of momentum and volatility, which are fundamental to its operation. Momentum refers to the rate of change of a security’s price. High momentum suggests strong buying or selling pressure, while low momentum indicates a lack of directional conviction. Volatility, on the other hand, measures the degree of price fluctuation over a given period. High volatility implies larger price swings, while low volatility signifies relatively stable prices.
The relationship between momentum and volatility is critical for understanding market dynamics. Periods of low volatility often precede significant price movements. This is because pent-up energy accumulates during consolidation phases, eventually leading to an explosive breakout. The momentum squeeze indicator is designed to identify these periods of low volatility and anticipate potential breakouts.
What is the Momentum Squeeze Indicator?
The momentum squeeze indicator is a technical analysis tool that combines momentum and volatility measurements to identify periods of market consolidation and potential breakout opportunities. It typically uses Bollinger Bands and Keltner Channels to gauge volatility and momentum. When the Bollinger Bands fall entirely inside the Keltner Channels, it signals a “squeeze,” indicating a period of low volatility. This suggests that the market is coiling up for a significant move.
The core principle behind the momentum squeeze indicator is that periods of low volatility are unsustainable. Eventually, the market will break out of its consolidation phase, leading to a substantial price movement. By identifying these squeeze periods, traders can position themselves to capitalize on the subsequent breakout.
How the Momentum Squeeze Indicator Works
The momentum squeeze indicator typically involves the following components and calculations:
- Bollinger Bands: These are volatility bands plotted above and below a simple moving average (SMA). The upper band is calculated as the SMA plus two standard deviations, while the lower band is calculated as the SMA minus two standard deviations.
- Keltner Channels: These are volatility bands plotted around an exponential moving average (EMA). The upper and lower bands are calculated by adding and subtracting a multiple of the Average True Range (ATR) from the EMA.
The squeeze is identified when the Bollinger Bands are completely contained within the Keltner Channels. This signals a period of low volatility and potential pent-up energy. Some variations of the indicator also include a momentum oscillator, such as the Relative Strength Index (RSI) or the Moving Average Convergence Divergence (MACD), to confirm the direction of the potential breakout.
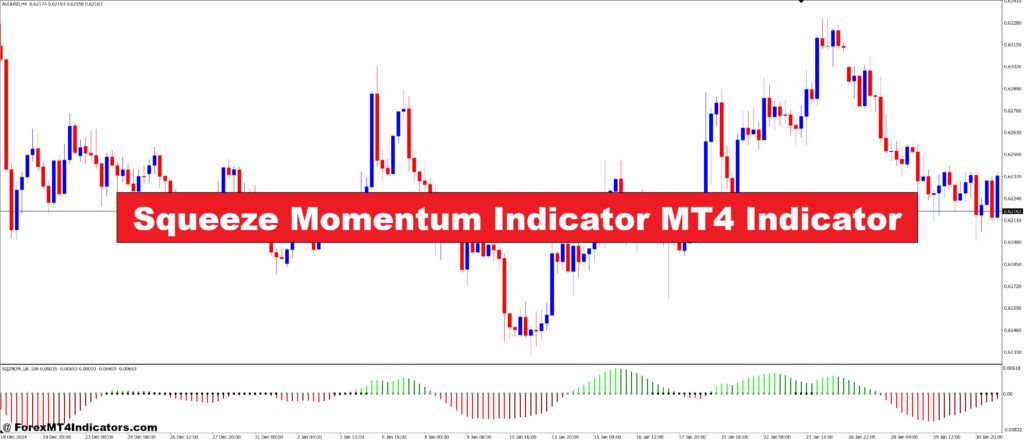
The squeeze is typically visualized on a chart using different colors or symbols to indicate when the squeeze is active and when it has been released. For example, a dot or a bar might change color when the Bollinger Bands move outside the Keltner Channels, signaling the end of the squeeze and the beginning of a potential breakout.
Interpreting the Momentum Squeeze Indicator
Interpreting the momentum squeeze indicator involves analyzing the squeeze periods and anticipating potential breakouts. Here are some key considerations:
- Squeeze Identification: Look for periods where the Bollinger Bands are entirely inside the Keltner Channels. This indicates a squeeze and potential for a breakout.
- Breakout Direction: Determine the likely direction of the breakout by analyzing other technical indicators, such as trendlines, support and resistance levels, and momentum oscillators.
- Confirmation: Wait for confirmation of the breakout before entering a trade. This could involve a price close above or below a key level, or a signal from a momentum oscillator.
- Stop-Loss Placement: Place a stop-loss order to limit potential losses in case the breakout fails. A common strategy is to place the stop-loss order just below the recent swing low (for a long trade) or just above the recent swing high (for a short trade).
- Target Setting: Set a profit target based on the potential magnitude of the breakout. This could involve using Fibonacci extensions or measuring the height of the consolidation pattern.
Using the Momentum Squeeze Indicator in Trading Strategies
The momentum squeeze indicator can be incorporated into various trading strategies. Here are a few examples:
Breakout Trading Strategy
This strategy involves identifying squeeze periods and waiting for a breakout in either direction. Traders can use trendlines, support and resistance levels, and momentum oscillators to determine the likely direction of the breakout. Once the breakout is confirmed, traders can enter a trade in the direction of the breakout with a stop-loss order placed just below the recent swing low (for a long trade) or just above the recent swing high (for a short trade). [See also: Breakout Trading Strategies for Beginners]
Range Trading Strategy
This strategy involves trading within the consolidation range during the squeeze period. Traders can buy at the lower end of the range and sell at the upper end of the range, with stop-loss orders placed just outside the range. This strategy is suitable for traders who prefer to trade in sideways markets. However, it’s important to be aware of the potential for a breakout and to adjust stop-loss orders accordingly. [See also: Mastering Range Trading]
Trend Following Strategy
This strategy involves using the momentum squeeze indicator to identify potential continuations of existing trends. Traders can look for squeeze periods that occur within the context of a larger uptrend or downtrend. Once the squeeze is released, traders can enter a trade in the direction of the trend with a stop-loss order placed just below the recent swing low (for a long trade) or just above the recent swing high (for a short trade). [See also: Advanced Trend Following Techniques]
Advantages and Limitations of the Momentum Squeeze Indicator
Like any technical indicator, the momentum squeeze indicator has its advantages and limitations. Here are some key considerations:
Advantages:
- Early Warning Signal: The momentum squeeze indicator can provide an early warning signal of potential breakouts, allowing traders to position themselves in advance.
- Objective Identification: The indicator provides an objective way to identify periods of low volatility and consolidation.
- Versatility: The indicator can be used in various trading strategies, including breakout trading, range trading, and trend following.
Limitations:
- False Signals: The indicator can generate false signals, especially in choppy or sideways markets.
- Lagging Indicator: The indicator is based on past price data and may lag behind actual price movements.
- Subjectivity: The interpretation of the indicator can be subjective, especially when it comes to determining the likely direction of the breakout.
Tips for Using the Momentum Squeeze Indicator Effectively
To use the momentum squeeze indicator effectively, consider the following tips:
- Combine with Other Indicators: Use the momentum squeeze indicator in conjunction with other technical indicators, such as trendlines, support and resistance levels, and momentum oscillators, to confirm signals and improve accuracy.
- Consider Market Context: Take into account the overall market context, including the prevailing trend, economic news, and geopolitical events, when interpreting the indicator.
- Practice Risk Management: Always practice sound risk management techniques, including setting stop-loss orders and managing position size, to protect your capital.
- Backtest and Optimize: Backtest the momentum squeeze indicator on historical data to determine its effectiveness and optimize its parameters for different market conditions.
- Stay Informed: Stay informed about the latest developments in technical analysis and trading strategies to enhance your understanding and improve your trading performance.
Real-World Examples of the Momentum Squeeze Indicator
To illustrate the practical application of the momentum squeeze indicator, let’s consider a few real-world examples. Imagine a stock that has been trading in a narrow range for several weeks, with the Bollinger Bands contained within the Keltner Channels. This signals a squeeze and potential for a breakout. If the stock is also trading above its 200-day moving average and showing positive momentum, traders might anticipate a breakout to the upside. Once the stock breaks above a key resistance level, traders can enter a long position with a stop-loss order placed just below the recent swing low.
Another example could involve a currency pair that has been trending downwards for several months. A squeeze might form during a period of consolidation, indicating a potential continuation of the downtrend. If the currency pair breaks below a key support level, traders can enter a short position with a stop-loss order placed just above the recent swing high.
The Future of the Momentum Squeeze Indicator
The momentum squeeze indicator remains a valuable tool for traders and investors seeking to identify potential breakout opportunities in the financial markets. As technology advances and new analytical techniques emerge, the indicator may evolve to incorporate more sophisticated calculations and visualizations. However, the fundamental principles of momentum and volatility will continue to play a crucial role in understanding market dynamics and predicting future price movements.
In conclusion, the momentum squeeze indicator is a powerful tool for identifying periods of market consolidation and anticipating potential breakouts. By understanding its underlying principles, how it works, and how it can be effectively used in trading strategies, traders can gain a competitive edge and improve their trading performance. Remember to use the indicator in conjunction with other technical indicators, consider the market context, practice risk management, and stay informed about the latest developments in technical analysis to maximize its effectiveness. The momentum squeeze indicator can be a valuable addition to any trader’s toolkit, providing insights into market dynamics and helping to identify profitable trading opportunities. Furthermore, remember to always conduct thorough research and due diligence before making any trading decisions, and consult with a qualified financial advisor if necessary.
