Unlocking Market Volatility: A Comprehensive Guide to the Squeeze Indicator
In the dynamic world of trading, identifying potential breakouts before they happen is crucial for maximizing profits and minimizing risks. One powerful tool that helps traders achieve this is the squeeze indicator. This indicator, often associated with John Carter’s work, identifies periods of low volatility that often precede significant price movements. Understanding how the squeeze indicator works, its components, and how to effectively use it can provide a significant edge in the market. This article provides a comprehensive guide to the squeeze indicator, exploring its mechanics, interpretation, and practical applications.
What is the Squeeze Indicator?
The squeeze indicator is a technical analysis tool designed to identify periods of market consolidation, or low volatility, that often precede significant price breakouts. It essentially flags moments when a market is coiled and ready to spring in either direction. The core principle behind the squeeze indicator is that periods of low volatility are usually followed by periods of high volatility. By identifying these low volatility periods, traders can prepare for potential breakouts.
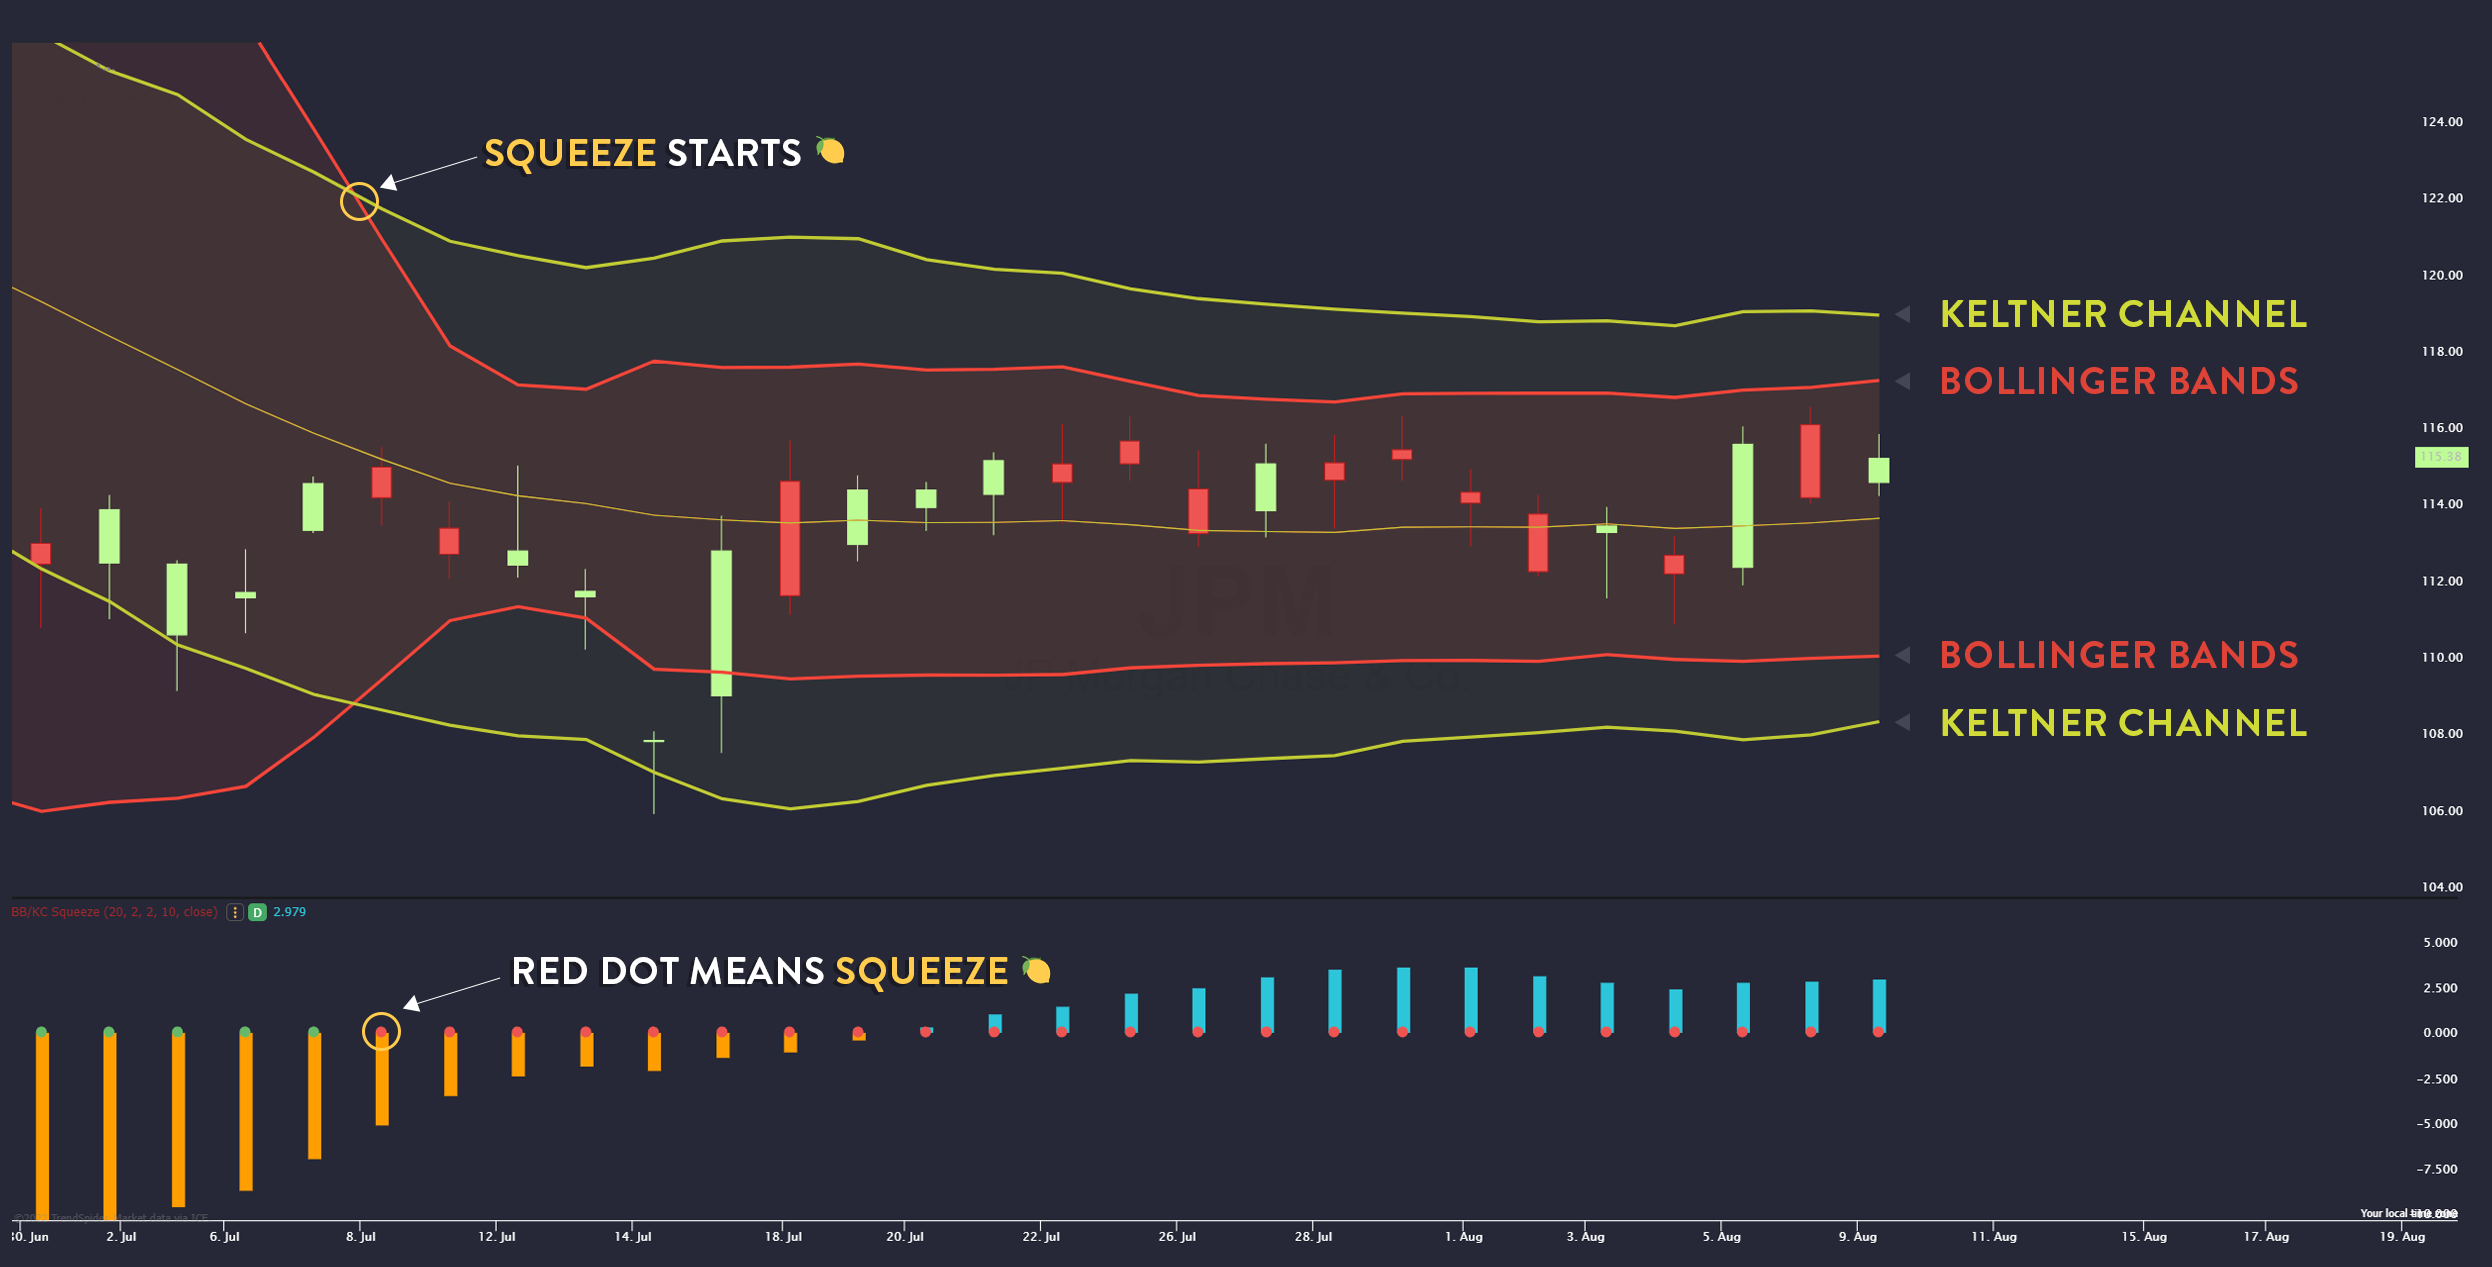
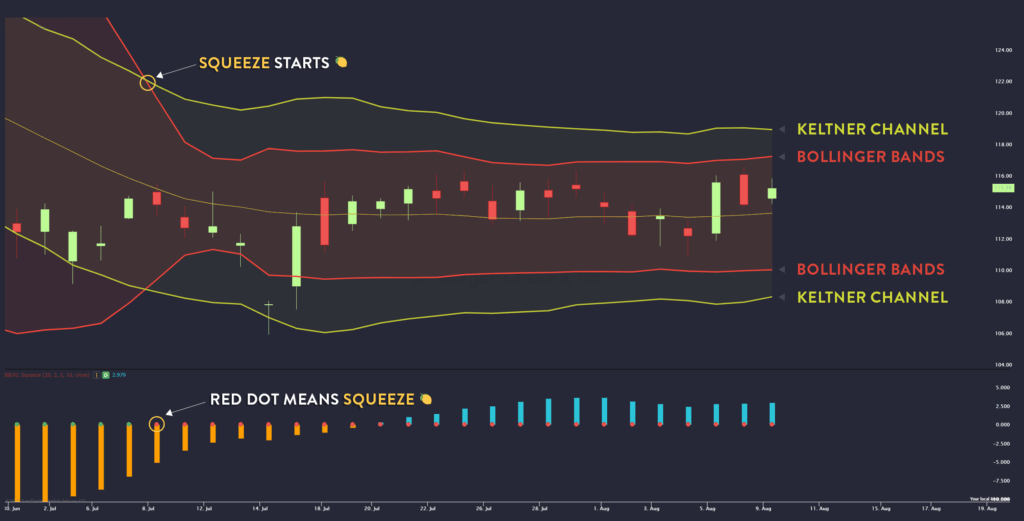
The squeeze indicator is primarily visualized using Bollinger Bands and Keltner Channels. When the Bollinger Bands are entirely inside the Keltner Channels, it indicates a squeeze. This condition suggests that volatility is unusually low and that a significant price move is likely imminent.
Components of the Squeeze Indicator
To fully understand the squeeze indicator, it’s important to understand its key components:
- Bollinger Bands: These bands are plotted two standard deviations away from a simple moving average (SMA). They measure the degree of price dispersion around the average. When the price is volatile, the bands widen; when the price is stable, the bands contract.
- Keltner Channels: These channels are plotted using the Average True Range (ATR) above and below an exponential moving average (EMA). The ATR measures the average range of price fluctuations over a specified period. Keltner Channels provide a broader view of volatility than Bollinger Bands.
- Squeeze: A squeeze occurs when the Bollinger Bands are completely contained within the Keltner Channels. This signifies a period of low volatility and potential for a significant price movement.
How the Squeeze Indicator Works
The squeeze indicator works by comparing the volatility ranges defined by Bollinger Bands and Keltner Channels. When the Bollinger Bands, which represent short-term volatility, are inside the Keltner Channels, which represent longer-term volatility, it signals a squeeze. This indicates that the market is in a period of consolidation and is likely to break out soon.
The indicator doesn’t predict the direction of the breakout; it only signals that a breakout is likely to occur. Traders must use other technical analysis tools and indicators to determine the potential direction of the breakout. Once a squeeze is identified, traders watch for the Bollinger Bands to break out of the Keltner Channels. This breakout is the signal that the price is starting to move significantly.
Interpreting the Squeeze Indicator
Interpreting the squeeze indicator involves understanding the different states it can be in and what they signify:
- Squeeze On: This is when the Bollinger Bands are inside the Keltner Channels, indicating low volatility and a potential breakout. Traders should prepare for a possible price movement in either direction.
- Squeeze Off: This is when the Bollinger Bands break out of the Keltner Channels, indicating that the squeeze has released and the price is starting to move. Traders should look for confirmation signals to determine the direction of the breakout.
- No Squeeze: This is when the Bollinger Bands are outside the Keltner Channels, indicating normal or high volatility. The market is not in a period of consolidation, and significant breakouts are less likely.
Using the Squeeze Indicator in Trading Strategies
The squeeze indicator can be used in various trading strategies to identify potential breakouts and manage risk. Here are a few common approaches:
Breakout Trading
In breakout trading, the squeeze indicator is used to identify potential breakout opportunities. When a squeeze is detected, traders watch for the price to break above or below key resistance or support levels. A breakout above resistance is a buy signal, while a breakout below support is a sell signal. It’s crucial to confirm the breakout with other indicators, such as volume, to avoid false signals.
Trend Following
In trend following, the squeeze indicator is used to confirm the continuation of an existing trend. When a squeeze occurs during an uptrend, traders look for a breakout to the upside. Conversely, when a squeeze occurs during a downtrend, traders look for a breakout to the downside. This strategy helps traders to enter trends at favorable prices and avoid getting caught in false breakouts.
Range Trading
In range trading, the squeeze indicator can be used to identify potential reversals within a defined range. When a squeeze occurs near the upper or lower boundary of the range, traders can anticipate a reversal and trade accordingly. However, it’s important to use other indicators, such as oscillators, to confirm the reversal and manage risk.
Combining the Squeeze Indicator with Other Tools
While the squeeze indicator is a powerful tool on its own, it can be even more effective when combined with other technical analysis tools and indicators. Here are a few examples:
- Volume: Volume can confirm the validity of a breakout. A significant increase in volume during a breakout suggests that the move is genuine and has strong momentum.
- Moving Averages: Moving averages can help identify the overall trend and provide potential support and resistance levels.
- Relative Strength Index (RSI): The RSI can help identify overbought or oversold conditions, which can signal potential reversals.
- MACD: The MACD can help confirm the direction of a breakout and identify potential trend changes.
By combining the squeeze indicator with these tools, traders can gain a more comprehensive view of the market and make more informed trading decisions.
Advantages and Disadvantages of Using the Squeeze Indicator
Like any technical analysis tool, the squeeze indicator has its advantages and disadvantages:
Advantages
- Early Identification of Breakouts: The squeeze indicator helps traders identify potential breakouts before they happen, allowing them to prepare for significant price movements.
- Objective Signals: The indicator provides clear and objective signals based on the relationship between Bollinger Bands and Keltner Channels.
- Versatility: The squeeze indicator can be used in various trading strategies, including breakout trading, trend following, and range trading.
- Compatibility: The indicator can be combined with other technical analysis tools and indicators to enhance its effectiveness.
Disadvantages
- False Signals: The squeeze indicator can generate false signals, especially in choppy or sideways markets.
- Lack of Directional Bias: The indicator doesn’t predict the direction of the breakout, requiring traders to use other tools to determine the potential direction.
- Lagging Indicator: The squeeze indicator is a lagging indicator, meaning it provides signals after the price has already started to move.
- Subjectivity in Interpretation: While the basic principles are clear, interpreting the squeeze indicator can still involve some subjectivity, especially when determining the significance of a breakout.
Real-World Examples of the Squeeze Indicator in Action
To illustrate how the squeeze indicator works in practice, let’s look at a few real-world examples:
Example 1: Stock Breakout
Imagine a stock that has been trading in a narrow range for several weeks. The Bollinger Bands are inside the Keltner Channels, indicating a squeeze. Suddenly, the stock price breaks above the upper boundary of the Keltner Channels on high volume. This confirms the breakout, and traders can enter a long position with a stop-loss order below the breakout level.
Example 2: Forex Trend Continuation
Consider a currency pair that is trending upwards. The squeeze indicator signals a squeeze, indicating a period of consolidation. When the price breaks above the upper boundary of the Keltner Channels, it confirms the continuation of the uptrend. Traders can add to their long positions with a stop-loss order below the recent swing low.
Tips for Using the Squeeze Indicator Effectively
To maximize the effectiveness of the squeeze indicator, consider the following tips:
- Use Multiple Timeframes: Analyze the squeeze indicator on multiple timeframes to get a more comprehensive view of the market.
- Confirm Breakouts: Always confirm breakouts with other indicators, such as volume, to avoid false signals.
- Manage Risk: Use stop-loss orders to limit potential losses and protect your capital.
- Practice and Experiment: Practice using the squeeze indicator in a demo account before trading with real money. Experiment with different settings and strategies to find what works best for you.
- Stay Informed: Keep up-to-date with market news and economic events that could impact the price of the assets you are trading.
Conclusion
The squeeze indicator is a valuable tool for traders looking to identify potential breakouts and manage risk. By understanding its components, how it works, and how to use it in conjunction with other technical analysis tools, traders can gain a significant edge in the market. While the squeeze indicator has its limitations, its ability to identify low volatility periods that often precede significant price movements makes it a valuable addition to any trader’s toolkit. Remember to always confirm signals, manage risk, and stay informed to maximize your chances of success.
By mastering the squeeze indicator, you can unlock new opportunities and improve your trading performance. Always remember to practice responsible trading and continuously refine your strategies based on market conditions and your own trading experience. Happy trading! [See also: Understanding Bollinger Bands] [See also: Mastering Keltner Channels] [See also: Advanced Technical Analysis Techniques]
