
Unlocking Profits: Mastering the Hammer Candle in Stock Trading
In the dynamic world of stock trading, understanding candlestick patterns is crucial for making informed decisions. Among these patterns, the hammer candle stands out as a significant indicator of potential bullish reversals. This article delves into the intricacies of the hammer candle pattern, its formation, interpretation, and application in stock trading. Whether you’re a seasoned investor or a novice trader, mastering the hammer candle can significantly enhance your trading strategy and profitability. Understanding the hammer candle stock implications can also help mitigate risks.
What is a Hammer Candle?
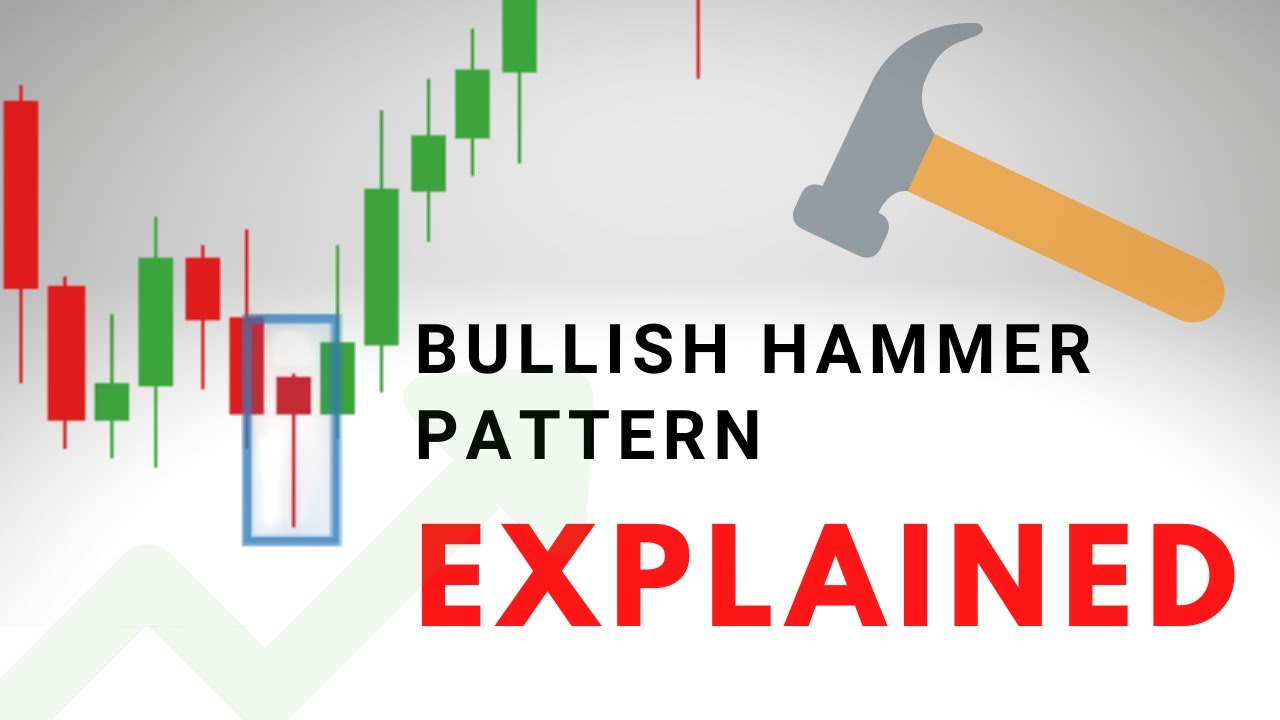
A hammer candle is a bullish reversal pattern that forms after a downtrend. It is characterized by a small body, a long lower shadow (or wick), and a short or non-existent upper shadow. The body of the candle represents the difference between the opening and closing prices, while the long lower shadow indicates that the price initially declined significantly during the trading period but then rebounded strongly to close near the opening price. This suggests that buyers stepped in and overpowered the sellers, potentially signaling the end of the downtrend.
Essentially, the hammer candle signifies a potential shift in market sentiment from bearish to bullish. The length of the lower shadow should be at least twice the length of the body. This characteristic long lower shadow is what makes the hammer candle so visually distinctive and important.
Key Characteristics of a Hammer Candle
- Small Body: The real body (the difference between the open and close price) is relatively small.
- Long Lower Shadow: The lower shadow is significantly longer than the body, usually at least twice the size.
- Short or Absent Upper Shadow: Ideally, there should be little to no upper shadow.
- Prior Downtrend: The hammer candle must form after a defined downtrend to be considered valid.
How to Identify a Hammer Candle on a Stock Chart
Identifying a hammer candle involves carefully examining candlestick charts. Look for a candle that meets the characteristics outlined above. Specifically, ensure that the candle appears after a period of price decline and that the lower shadow is significantly longer than the body. Pay close attention to the color of the body; while the body can be either bullish (white or green) or bearish (black or red), a bullish body generally provides a stronger signal.
To confirm the validity of the hammer candle, consider the following:
- Previous Trend: Has the stock been in a clear downtrend?
- Shadow Length: Is the lower shadow at least twice the length of the body?
- Confirmation: Wait for confirmation in the subsequent trading session, such as a bullish candle that closes above the high of the hammer candle.
Interpretation of the Hammer Candle
The hammer candle is interpreted as a signal of potential bullish reversal. The long lower shadow indicates that sellers initially drove the price down, but buyers stepped in and pushed the price back up, demonstrating strong buying pressure. This suggests that the downtrend may be losing momentum, and a bullish reversal could be imminent. The hammer candle stock pattern shows buyers taking control.
However, it is crucial to note that the hammer candle is not a guaranteed predictor of a reversal. It is merely an indication of a potential shift in market sentiment. Therefore, it is essential to use other technical indicators and analysis tools to confirm the signal before making any trading decisions. Volume analysis can also be helpful; a higher volume on the hammer candle day further strengthens the signal.
Trading Strategies Using the Hammer Candle
Several trading strategies can be employed using the hammer candle pattern. Here are a few common approaches:
Confirmation Entry
Wait for confirmation in the subsequent trading session before entering a long position. This confirmation could be a bullish candle that closes above the high of the hammer candle. This approach reduces the risk of false signals.
Stop-Loss Placement
Place a stop-loss order below the low of the hammer candle to limit potential losses if the price continues to decline. This ensures that you exit the trade if the reversal does not materialize.
Target Setting
Set a profit target based on technical analysis, such as Fibonacci retracement levels or previous resistance levels. This helps to define your potential profit and manage your risk-reward ratio. Understanding support and resistance levels is key when using the hammer candle stock pattern.
Combining with Other Indicators
Use the hammer candle in conjunction with other technical indicators, such as moving averages, Relative Strength Index (RSI), or Moving Average Convergence Divergence (MACD), to improve the accuracy of your trading signals. [See also: RSI Divergence Trading Strategy] For example, if the RSI is oversold and a hammer candle forms, it could provide a stronger signal of a potential reversal.
Examples of Hammer Candles in Stock Trading
Let’s consider a hypothetical example. Suppose you are analyzing the stock chart of XYZ Corp, and you notice a clear downtrend over the past few weeks. Suddenly, a hammer candle forms, with a small body and a long lower shadow. The lower shadow is more than twice the length of the body. The next day, a bullish candle closes above the high of the hammer candle. This confirms the bullish reversal signal. You decide to enter a long position, placing a stop-loss order below the low of the hammer candle and setting a profit target based on a previous resistance level.
Another example could involve using the hammer candle in conjunction with the RSI. If the RSI is below 30 (indicating an oversold condition) and a hammer candle forms, this could be a strong indication that the stock is poised for a reversal. [See also: Using RSI for Stock Trading]
Limitations of the Hammer Candle
While the hammer candle can be a valuable tool for identifying potential bullish reversals, it is not without its limitations. One of the main limitations is that it can produce false signals. Not every hammer candle will result in a successful reversal. The market context, including overall market sentiment and economic news, can significantly impact the effectiveness of the pattern.
Another limitation is that the hammer candle only provides an indication of a potential reversal; it does not provide information about the magnitude or duration of the reversal. Traders must use other technical analysis tools to estimate the potential upside and the appropriate timeframe for the trade.
The Inverted Hammer Candle
It’s important to differentiate the hammer candle from its counterpart, the inverted hammer. While both signal potential reversals, they appear in different contexts. The inverted hammer appears at the end of a downtrend and has a long upper shadow and a small body at the bottom. It suggests that buyers attempted to push the price higher but were ultimately met with selling pressure, though the price still closed near the high of the day. This indicates potential future bullish momentum if confirmed by subsequent bullish candles.
Hammer Candle vs. Hanging Man
The hanging man is another candlestick pattern that resembles the hammer candle but appears at the end of an uptrend, signaling a potential bearish reversal. Like the hammer candle, it has a small body and a long lower shadow. However, its appearance after an uptrend gives it a different interpretation. The hanging man suggests that selling pressure is increasing, and a bearish reversal may be imminent.
Psychology Behind the Hammer Candle
Understanding the psychology behind the hammer candle can provide valuable insights into its effectiveness. The long lower shadow represents a battle between buyers and sellers. Initially, sellers are in control, driving the price down. However, buyers then step in and aggressively push the price back up, demonstrating their strength and determination. This shift in power suggests that the downtrend may be losing momentum, and a bullish reversal is likely. The hammer candle stock pattern captures this psychological shift effectively.
Best Practices for Trading Hammer Candles
- Confirm the Signal: Always wait for confirmation in the subsequent trading session before entering a trade.
- Use Stop-Loss Orders: Protect your capital by placing stop-loss orders below the low of the hammer candle.
- Combine with Other Indicators: Improve the accuracy of your trading signals by using the hammer candle in conjunction with other technical indicators.
- Consider Market Context: Pay attention to overall market sentiment and economic news.
- Practice Risk Management: Never risk more than you can afford to lose.
Conclusion
The hammer candle is a powerful tool for identifying potential bullish reversals in stock trading. By understanding its formation, interpretation, and limitations, traders can enhance their trading strategies and improve their profitability. However, it is essential to remember that the hammer candle is not a foolproof predictor of a reversal and should be used in conjunction with other technical indicators and analysis tools. Mastering the hammer candle pattern can provide a significant edge in the competitive world of stock trading, especially when analyzing hammer candle stock behavior. Always practice risk management and stay informed about market conditions to make well-informed trading decisions. [See also: Advanced Candlestick Patterns for Day Trading]
