
Unlocking Profits with the Hammer Candlestick Pattern: A Trader’s Guide
In the dynamic world of stock trading, identifying patterns is crucial for making informed decisions. Among the most recognizable and potentially profitable patterns is the hammer candlestick. This guide provides a comprehensive overview of the hammer candlestick, its characteristics, how to identify it, and how to use it effectively in your trading strategy. Understanding the nuances of the hammer stock candlestick can significantly enhance your ability to predict market reversals and capitalize on potential gains.
What is a Hammer Candlestick?
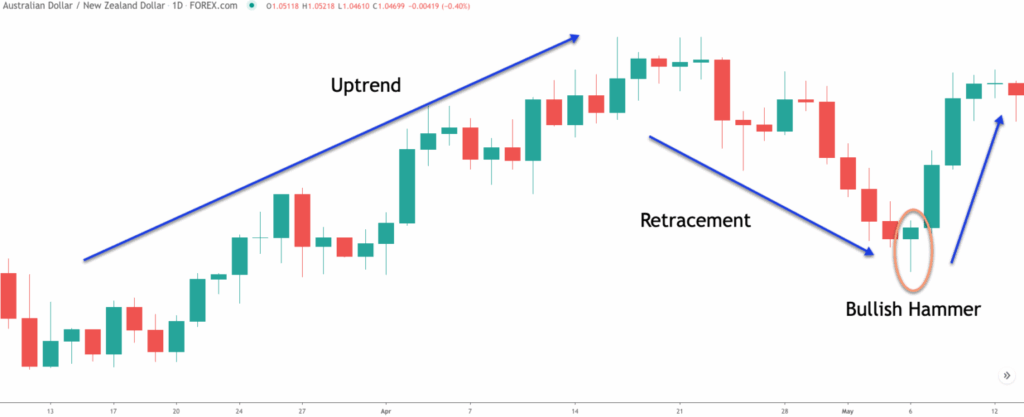
A hammer candlestick is a bullish reversal pattern that appears at the bottom of a downtrend. It signals a potential shift in market sentiment from bearish to bullish. The hammer is characterized by a small body, a long lower shadow (or wick), and little or no upper shadow. The length of the lower shadow should be at least twice the length of the body. This indicates that although sellers initially drove the price down, buyers stepped in and pushed the price back up, suggesting a potential bottom.
Key Characteristics of a Hammer Candlestick
- Small Body: The real body (the area between the open and close price) should be small, regardless of whether it’s bullish (white or green) or bearish (black or red).
- Long Lower Shadow: The lower shadow should be at least twice the length of the body. This signifies strong buying pressure during the trading period.
- Little or No Upper Shadow: Ideally, there should be little to no upper shadow. A significant upper shadow weakens the signal.
- Prior Downtrend: The hammer candlestick is only valid if it appears after a defined downtrend.
How to Identify a Valid Hammer Pattern
Identifying a valid hammer pattern requires careful observation and analysis of the candlestick chart. Here’s a step-by-step guide:
- Identify a Downtrend: Ensure the stock or asset has been in a clear downtrend before the potential hammer appears.
- Look for the Candlestick Shape: Scan the chart for a candlestick with a small body, a long lower shadow, and little to no upper shadow.
- Confirm the Length of the Lower Shadow: Verify that the lower shadow is at least twice the length of the body.
- Consider the Color of the Body: While not essential, a bullish (white or green) body can add strength to the signal. A bearish (black or red) body is still valid, but the reversal signal may be slightly weaker.
- Confirmation: Wait for confirmation in the subsequent trading period. This usually comes in the form of a bullish candlestick that closes above the close of the hammer.
Trading Strategies Using the Hammer Candlestick
Once you’ve identified a valid hammer candlestick, you can incorporate it into your trading strategy. Here are several approaches:
Entry Points
The most common entry point is after confirmation. Wait for the next candlestick to close above the closing price of the hammer. This confirms that the bullish momentum is continuing and reduces the risk of a false signal. Another approach is to enter a trade at the open of the next candlestick after the hammer, anticipating that the price will continue to rise.
Stop-Loss Orders
Proper risk management is crucial. Place your stop-loss order below the low of the hammer candlestick. This protects your capital if the reversal fails and the price continues to decline.
Profit Targets
Setting realistic profit targets is essential for successful trading. You can use several methods to determine your profit target, such as:
- Fibonacci Retracement Levels: Identify key Fibonacci retracement levels to anticipate potential resistance areas.
- Previous Resistance Levels: Look for previous resistance levels on the chart that could act as profit targets.
- Risk-Reward Ratio: Aim for a favorable risk-reward ratio, such as 1:2 or 1:3, where your potential profit is at least twice or three times your potential loss.
Hammer Candlestick vs. Hanging Man Candlestick
It’s important to differentiate the hammer candlestick from the hanging man candlestick, as they appear similar but have different implications. The hanging man is a bearish reversal pattern that appears at the top of an uptrend. Like the hammer, it has a small body and a long lower shadow. However, because it appears after an uptrend, it suggests that selling pressure is increasing and that a reversal to the downside is possible. The hammer candlestick, on the other hand, signals a potential reversal from a downtrend to an uptrend.
The Inverted Hammer Candlestick Pattern
The inverted hammer candlestick is another bullish reversal pattern that can be found at the bottom of a downtrend. Unlike the standard hammer, the inverted hammer has a long upper shadow and a small body near its low. This pattern suggests that buyers attempted to push the price higher, but faced resistance. However, the fact that the price did not fall back to its previous low indicates that the selling pressure is weakening and a reversal may be imminent. The inverted hammer also requires confirmation from a subsequent bullish candlestick.
Psychology Behind the Hammer Pattern
Understanding the psychology behind the hammer candlestick can provide further insight into its effectiveness. The long lower shadow represents a battle between buyers and sellers. Initially, sellers are in control, driving the price down to a new low. However, buyers step in and aggressively push the price back up, often near the opening price. This shows that buyers are gaining strength and that the downtrend may be losing momentum. The small body indicates that the open and close prices are relatively close, suggesting indecision in the market. However, the overall message is bullish, as the buyers have demonstrated their ability to overcome selling pressure.
Limitations of the Hammer Candlestick
While the hammer candlestick can be a valuable tool, it’s important to be aware of its limitations. The hammer is not always accurate, and false signals can occur. It’s crucial to use other technical indicators and analysis techniques to confirm the signal. Volume analysis can also be helpful. A hammer accompanied by high volume is generally more reliable than one with low volume. Market context is also important. Consider the overall market trend and economic conditions when interpreting the hammer.
Examples of Hammer Candlestick in Real-World Scenarios
Let’s consider a hypothetical example. Suppose you are tracking a stock that has been in a downtrend for several weeks. You notice a hammer candlestick forming at a key support level. The hammer has a small body, a long lower shadow, and little to no upper shadow. The next day, the stock opens higher and closes above the closing price of the hammer. This confirms the bullish reversal signal. You decide to enter a long position, placing your stop-loss order below the low of the hammer. You set a profit target based on a previous resistance level or a Fibonacci retracement level. If the stock price rises to your profit target, you can close your position and realize a profit.
Combining Hammer Candlestick with Other Indicators
To increase the reliability of the hammer candlestick, consider combining it with other technical indicators, such as:
- Moving Averages: Use moving averages to identify the overall trend and potential support and resistance levels.
- Relative Strength Index (RSI): The RSI can help you determine if the stock is oversold, which can increase the likelihood of a bullish reversal.
- MACD: The MACD can provide further confirmation of a trend reversal.
- Volume Analysis: High volume during the formation of the hammer strengthens the pattern’s reliability.
Conclusion
The hammer candlestick is a powerful tool for identifying potential bullish reversals in the stock market. By understanding its characteristics, how to identify it, and how to use it in conjunction with other technical indicators, you can significantly improve your trading success. Remember to always use proper risk management techniques and to confirm the signal before entering a trade. The stock candlestick hammer, when properly identified and acted upon, can be a valuable asset in any trader’s toolkit. This pattern provides a visual representation of potential market shifts, allowing traders to make more informed decisions and capitalize on emerging opportunities. Continue to study and practice identifying the hammer to refine your trading skills and boost your profitability.
[See also: Understanding Candlestick Patterns for Profitable Trading]
[See also: Mastering Technical Analysis for Stock Market Success]
[See also: Risk Management Strategies for Day Traders]
