Unlocking Trading Insights with the Volume Profile Visible Range (VPVR) Indicator
In the dynamic world of financial markets, traders and investors constantly seek reliable tools to enhance their decision-making process. Among the plethora of indicators available, the Volume Profile Visible Range (VPVR) indicator stands out as a powerful instrument for analyzing market behavior. This article delves into the intricacies of the VPVR indicator, exploring its functionality, benefits, and practical applications in trading strategies. Understanding the VPVR can give traders a significant edge by providing a clearer picture of price levels where the most volume has occurred, thereby highlighting potential support and resistance areas. The VPVR indicator is an essential tool for any serious trader.
Understanding the Volume Profile Visible Range (VPVR) Indicator
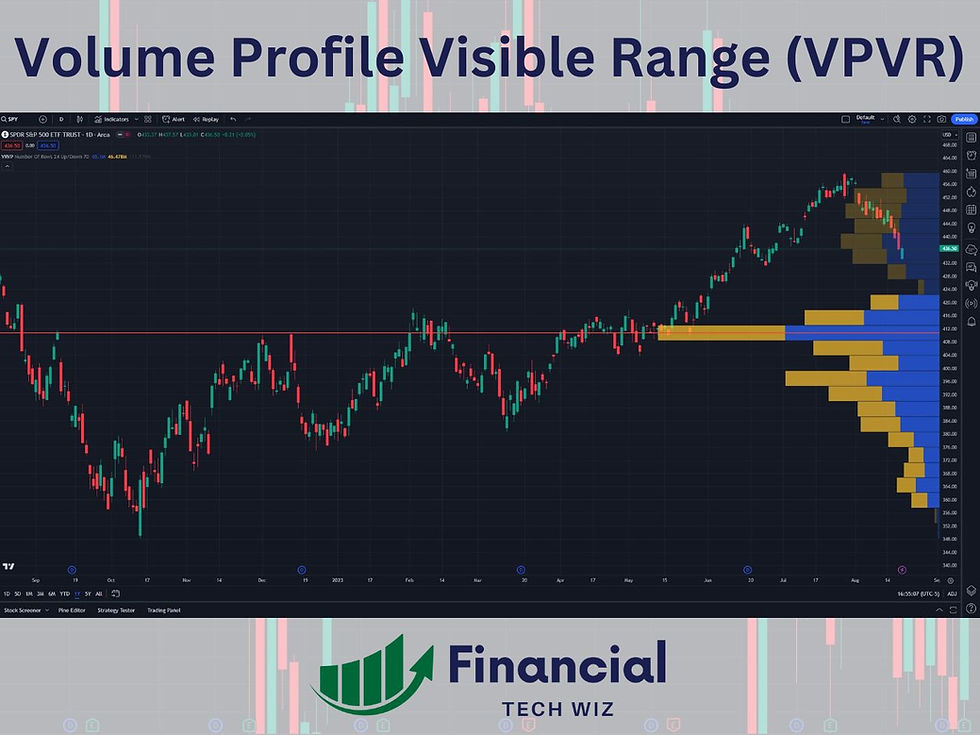
The Volume Profile Visible Range (VPVR) is an advanced charting tool that displays volume data at specific price levels for the visible portion of a chart. Unlike traditional volume indicators that show volume over time, the VPVR maps volume onto price, revealing the most actively traded price levels within the current view. This provides traders with valuable insights into market sentiment and potential areas of interest.
The VPVR indicator essentially creates a histogram overlaid on the price chart, where each bar represents the total volume traded at a specific price level. The longer the bar, the more volume traded at that price. By visualizing volume in this way, traders can quickly identify key support and resistance levels, as well as areas of value and potential order flow.
Key Components of the VPVR Indicator
- Point of Control (POC): The price level with the highest traded volume within the visible range. This is often considered a significant area of agreement or fair value.
- Value Area (VA): The range of prices where a specified percentage (typically 70%) of all volume traded. This area represents the price levels where the majority of market participants have transacted.
- Value Area High (VAH): The highest price level within the Value Area.
- Value Area Low (VAL): The lowest price level within the Value Area.
How the VPVR Indicator Works
The VPVR calculates volume at each price level within the visible range of the chart. It then aggregates this data to create a profile showing the distribution of volume across different price points. The Point of Control (POC) is determined by identifying the price with the highest volume, while the Value Area is calculated by finding the price range that contains a predetermined percentage (usually 70%) of the total volume. These components provide traders with a comprehensive view of market activity and potential price movements.
The indicator dynamically adjusts as the visible range of the chart changes, ensuring that the volume profile reflects the most current market data. This adaptability makes the VPVR a powerful tool for analyzing both short-term and long-term trends.
Benefits of Using the VPVR Indicator
Incorporating the VPVR indicator into your trading strategy offers several significant advantages:
- Identifying Key Support and Resistance Levels: The VPVR highlights price levels where significant volume has traded, indicating potential areas where price may find support or encounter resistance.
- Determining Areas of Value: The Value Area identifies the price range where the majority of market participants have transacted, providing insights into areas of perceived fair value.
- Understanding Market Sentiment: By analyzing the distribution of volume across different price levels, traders can gain a better understanding of market sentiment and potential future price movements.
- Improving Trade Entry and Exit Points: The VPVR can help traders identify optimal entry and exit points by highlighting areas of high volume and potential price reversals.
- Enhancing Risk Management: By providing a clearer picture of market structure, the VPVR can assist traders in setting more effective stop-loss orders and profit targets.
Practical Applications of the VPVR Indicator in Trading Strategies
The VPVR can be integrated into various trading strategies to improve accuracy and efficiency. Here are some practical applications:
Support and Resistance Trading
Traders can use the VPVR to identify key support and resistance levels. When price approaches a high-volume area, it may encounter resistance, providing an opportunity for short trades. Conversely, when price approaches a low-volume area, it may find support, offering a chance for long trades. [See also: Identifying Key Support and Resistance Levels]
Breakout Trading
The VPVR can help traders identify potential breakout opportunities. When price breaks above a high-volume area, it may indicate a strong bullish trend, offering a chance for long trades. Conversely, when price breaks below a low-volume area, it may signal a strong bearish trend, providing an opportunity for short trades.
Mean Reversion Trading
Traders can use the VPVR to identify areas of value and potential mean reversion opportunities. When price deviates significantly from the Point of Control (POC), it may be likely to revert back to the POC, offering a chance for trades in the opposite direction. [See also: Understanding Mean Reversion Strategies]
Combining VPVR with Other Indicators
The VPVR can be combined with other technical indicators, such as moving averages, Relative Strength Index (RSI), and MACD, to confirm signals and improve the accuracy of trading decisions. For example, traders can use the VPVR to identify potential support and resistance levels and then use RSI to confirm overbought or oversold conditions before entering a trade.
VPVR Indicator Settings and Customization
Most trading platforms offer customization options for the VPVR indicator, allowing traders to adjust settings to suit their individual preferences and trading styles. Common settings include:
- Volume Profile Width: Adjusts the width of the volume profile bars.
- Value Area Percentage: Determines the percentage of volume included in the Value Area (typically set to 70%).
- Number of Rows: Controls the granularity of the volume profile, with more rows providing a more detailed view.
- Color Customization: Allows traders to change the colors of the volume profile bars, Point of Control, and Value Area to improve visibility.
Experimenting with different settings can help traders optimize the VPVR indicator for their specific trading strategies and market conditions.
Common Mistakes to Avoid When Using the VPVR Indicator
While the VPVR is a powerful tool, it is essential to avoid common mistakes that can lead to inaccurate analysis and poor trading decisions:
- Relying Solely on the VPVR: The VPVR should not be used in isolation. It is crucial to combine it with other technical indicators and fundamental analysis to confirm signals and improve accuracy.
- Ignoring Market Context: Consider the overall market trend and economic conditions when interpreting the VPVR. A high-volume area may not act as strong support or resistance if the market is in a strong uptrend or downtrend.
- Over-Optimizing Settings: Avoid over-optimizing the VPVR settings, as this can lead to curve-fitting and poor performance in live trading.
- Ignoring Volatility: Be aware of market volatility when using the VPVR. High volatility can cause price to move rapidly through high-volume areas, making it more difficult to identify reliable support and resistance levels.
Examples of Successful VPVR Trading Strategies
Several successful trading strategies incorporate the VPVR to enhance decision-making. These strategies often combine the VPVR with other technical indicators and risk management techniques.
VPVR with Moving Averages
This strategy involves using the VPVR to identify potential support and resistance levels and then using moving averages to confirm the trend direction. For example, if price is above a 200-day moving average and approaching a high-volume area identified by the VPVR, it may indicate a strong bullish trend and a potential buying opportunity.
VPVR with Fibonacci Retracements
This strategy combines the VPVR with Fibonacci retracement levels to identify potential entry and exit points. Traders can use the VPVR to identify key support and resistance levels and then use Fibonacci retracements to identify potential retracement levels within those areas. [See also: Mastering Fibonacci Retracement Levels]
The Future of VPVR Indicator
As technology advances, the VPVR indicator is likely to become even more sophisticated. Future enhancements may include:
- Integration with Artificial Intelligence (AI): AI could be used to analyze the VPVR in real-time and provide traders with automated trading signals.
- Improved Visualization: New visualization techniques could make the VPVR even easier to understand and use.
- Enhanced Customization: Traders may have more options to customize the VPVR settings to suit their individual trading styles and market conditions.
Conclusion
The Volume Profile Visible Range (VPVR) indicator is a valuable tool for traders and investors seeking to gain a deeper understanding of market dynamics. By visualizing volume at different price levels, the VPVR provides insights into key support and resistance areas, areas of value, and potential price movements. Incorporating the VPVR into your trading strategy can improve accuracy, enhance risk management, and ultimately lead to more profitable trading decisions. As with any trading tool, it is essential to use the VPVR in conjunction with other technical indicators and fundamental analysis to confirm signals and avoid common mistakes. With the right approach, the VPVR indicator can be a powerful asset in your trading arsenal.
