Unveiling the Hammer Pattern: A Comprehensive Guide for Stock Traders
The stock market is a dynamic arena where fortunes can be made or lost in a matter of moments. Navigating this complex landscape requires a keen understanding of various technical analysis tools, and one such tool is the hammer pattern. This article provides a comprehensive overview of the hammer pattern, a bullish reversal pattern that can signal a potential upward trend in a downtrending stock. We will explore its characteristics, how to identify it, its limitations, and strategies for incorporating it into your trading plan.
What is the Hammer Pattern?
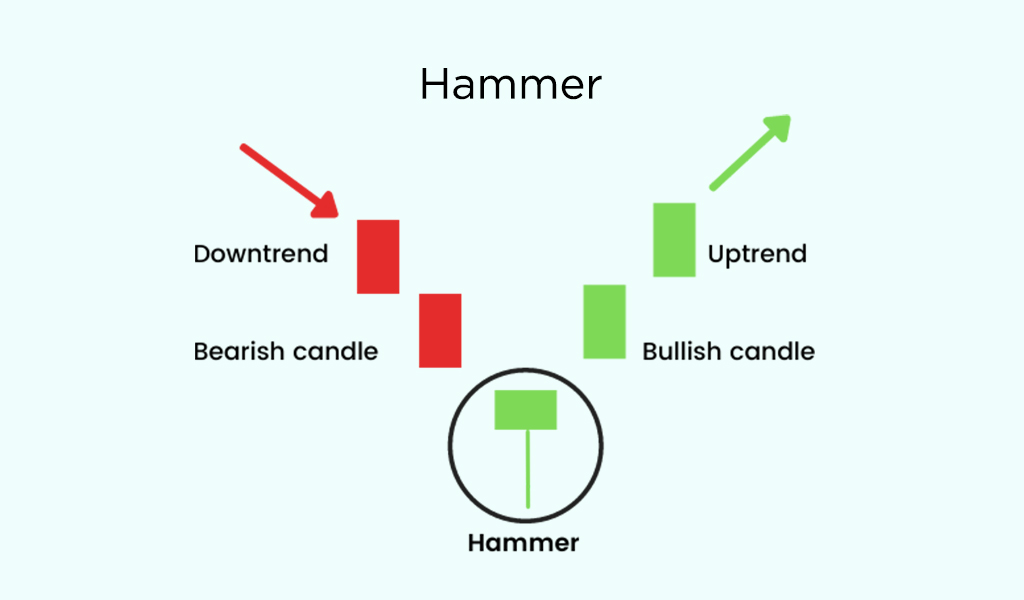
The hammer pattern is a single candlestick pattern that appears on a price chart, primarily in downtrends. It suggests that the downtrend may be nearing its end and that a bullish reversal might be imminent. Visually, it resembles a hammer, hence the name. The candlestick is characterized by a small body, a long lower shadow (or wick), and little to no upper shadow.
Key Characteristics of a Hammer Pattern:
- Small Body: The real body (the distance between the open and close price) is small, indicating a limited price range during the trading period.
- Long Lower Shadow: The lower shadow is at least twice the length of the body. This long shadow signifies that sellers initially drove the price down significantly, but buyers stepped in to push the price back up towards the opening price.
- Little to No Upper Shadow: Ideally, there should be little to no upper shadow. A longer upper shadow weakens the bullish signal.
- Preceding Downtrend: The hammer pattern must occur after a period of price decline to be considered valid.
How to Identify a Valid Hammer Pattern
Identifying a hammer pattern requires careful observation and adherence to specific criteria. Not every candlestick resembling a hammer is a valid signal. Here’s a step-by-step guide:
- Identify a Downtrend: The first step is to confirm that the stock is in a downtrend. Look for a series of lower highs and lower lows.
- Look for the Candlestick Shape: Scan the price chart for a candlestick with a small body, a long lower shadow, and little to no upper shadow. The lower shadow should be significantly longer (at least twice) than the body.
- Consider the Color of the Body: While not mandatory, a bullish (white or green) body is generally considered a stronger signal than a bearish (black or red) body. A bullish body indicates that the closing price was higher than the opening price, further reinforcing the bullish sentiment.
- Confirmation is Key: Never trade solely based on the hammer pattern. Always wait for confirmation from subsequent candlesticks or other technical indicators. A confirming signal could be a gap up in the next trading session or a strong bullish candlestick following the hammer pattern.
The Psychology Behind the Hammer Pattern
Understanding the psychology behind the hammer pattern provides valuable insights into why it works. During a downtrend, sellers are in control, driving the price lower. When the hammer pattern forms, it signifies a potential shift in sentiment. The long lower shadow indicates that sellers initially pushed the price down substantially, but buyers stepped in and aggressively bought the dip, driving the price back up towards the opening level. This suggests that buyers are gaining strength and that the downtrend may be losing momentum.
The small body reflects indecision and a potential equilibrium between buyers and sellers. The lack of an upper shadow suggests that buyers managed to hold the price near the high for the period, reinforcing the bullish outlook. The combination of these factors creates a potential reversal signal.
Trading Strategies Using the Hammer Pattern
The hammer pattern can be a valuable tool in your trading arsenal, but it’s crucial to use it wisely and in conjunction with other indicators. Here are some common trading strategies:
- Entry Point: After confirming the hammer pattern with a subsequent bullish candlestick or a gap up, consider entering a long position. A common entry point is above the high of the hammer pattern candlestick.
- Stop-Loss Placement: Protect your capital by placing a stop-loss order below the low of the hammer pattern candlestick. This helps limit potential losses if the pattern fails.
- Profit Target: Determine a profit target based on your risk-reward ratio and other technical indicators, such as resistance levels or Fibonacci retracement levels.
- Combine with Other Indicators: Enhance the reliability of the hammer pattern by combining it with other technical indicators, such as the Relative Strength Index (RSI), Moving Averages, or MACD. For example, if the RSI is oversold when the hammer pattern forms, it strengthens the bullish signal.
Examples of Hammer Patterns in Real-World Scenarios
Let’s consider a hypothetical example. Imagine a stock has been in a downtrend for several weeks, consistently making lower highs and lower lows. Suddenly, a hammer pattern forms. The candlestick has a small body, a long lower shadow that is more than twice the length of the body, and virtually no upper shadow. The next day, the stock gaps up and closes higher. This confirms the hammer pattern, and a trader might enter a long position above the high of the hammer pattern, placing a stop-loss below the low of the hammer pattern.
Another example might involve a stock that’s been declining due to negative news. As the selling pressure intensifies, a hammer pattern emerges. The long lower shadow reflects a rejection of lower prices, suggesting that the negative sentiment may be waning. If the subsequent candlesticks show bullish momentum, it could indicate a trend reversal.
Limitations of the Hammer Pattern
While the hammer pattern can be a useful indicator, it’s essential to be aware of its limitations:
- False Signals: Like all technical indicators, the hammer pattern can produce false signals. Not every hammer pattern leads to a trend reversal.
- Market Context: The effectiveness of the hammer pattern can vary depending on the overall market context. In a strong downtrend, a single hammer pattern may not be sufficient to reverse the trend.
- Confirmation is Crucial: Trading solely based on the hammer pattern without confirmation can be risky. Always wait for confirmation from subsequent candlesticks or other indicators.
- Subjectivity: Identifying a hammer pattern can be somewhat subjective. Different traders may interpret the same candlestick differently.
The Inverted Hammer Pattern
It’s important not to confuse the hammer pattern with the inverted hammer pattern. While both are single candlestick patterns that can signal potential reversals, they have different characteristics. The inverted hammer has a small body, a long upper shadow, and little to no lower shadow. It appears in downtrends and suggests that buyers are starting to exert some influence, but it still requires confirmation before acting upon it. It is the inverse of the hammer pattern.
Hammer Pattern vs. Hanging Man
The hanging man pattern looks similar to the hammer pattern but occurs at the end of an uptrend. It is considered a bearish reversal pattern, unlike the bullish hammer pattern. The context in which the pattern appears is crucial in determining its significance.
Tools and Resources for Identifying Hammer Patterns
Many charting platforms and trading software offer tools that can automatically identify candlestick patterns, including the hammer pattern. These tools can save time and effort in scanning through numerous price charts. Some popular platforms include TradingView, MetaTrader, and Thinkorswim. Additionally, numerous websites and books provide educational resources on candlestick patterns and technical analysis.
Conclusion
The hammer pattern is a valuable tool for stock traders seeking to identify potential bullish reversals in downtrending stocks. By understanding its characteristics, how to identify it, its limitations, and effective trading strategies, you can enhance your ability to make informed trading decisions. Remember to always use the hammer pattern in conjunction with other technical indicators and to prioritize risk management. The hammer pattern, when properly understood and applied, can be a powerful addition to your trading toolkit, helping you navigate the complexities of the stock market with greater confidence. Recognizing a valid hammer pattern can provide an edge, especially when combined with sound risk management. The hammer pattern is not a guaranteed win, but it is a valuable piece of the puzzle. Always confirm the hammer pattern. The appearance of a hammer pattern is a signal, not a command. The hammer pattern is a widely discussed and analyzed candlestick pattern. Learning about the hammer pattern can significantly improve your trading skills. Remember the key features of the hammer pattern. Using the hammer pattern requires patience and discipline. The hammer pattern can be used in various markets, not just stocks. The hammer pattern is a foundational concept in technical analysis. The hammer pattern, along with other candlestick patterns, can help you understand market sentiment. The hammer pattern is a tool to be used with caution and understanding.
[See also: Candlestick Patterns for Day Trading]
[See also: Technical Analysis for Beginners]
[See also: Risk Management in Stock Trading]
