
Unveiling the Hammer Pattern in Stock Trading: A Comprehensive Guide
The world of stock trading is filled with patterns, indicators, and signals that traders use to make informed decisions. Among these, the hammer pattern stands out as a potentially powerful bullish reversal signal. Understanding the hammer pattern is crucial for any trader looking to identify potential buying opportunities. This comprehensive guide will delve into the intricacies of the hammer pattern, exploring its characteristics, how to identify it, and strategies for incorporating it into your trading plan. We’ll also discuss its limitations and how to combine it with other technical indicators for enhanced accuracy.
What is the Hammer Pattern?
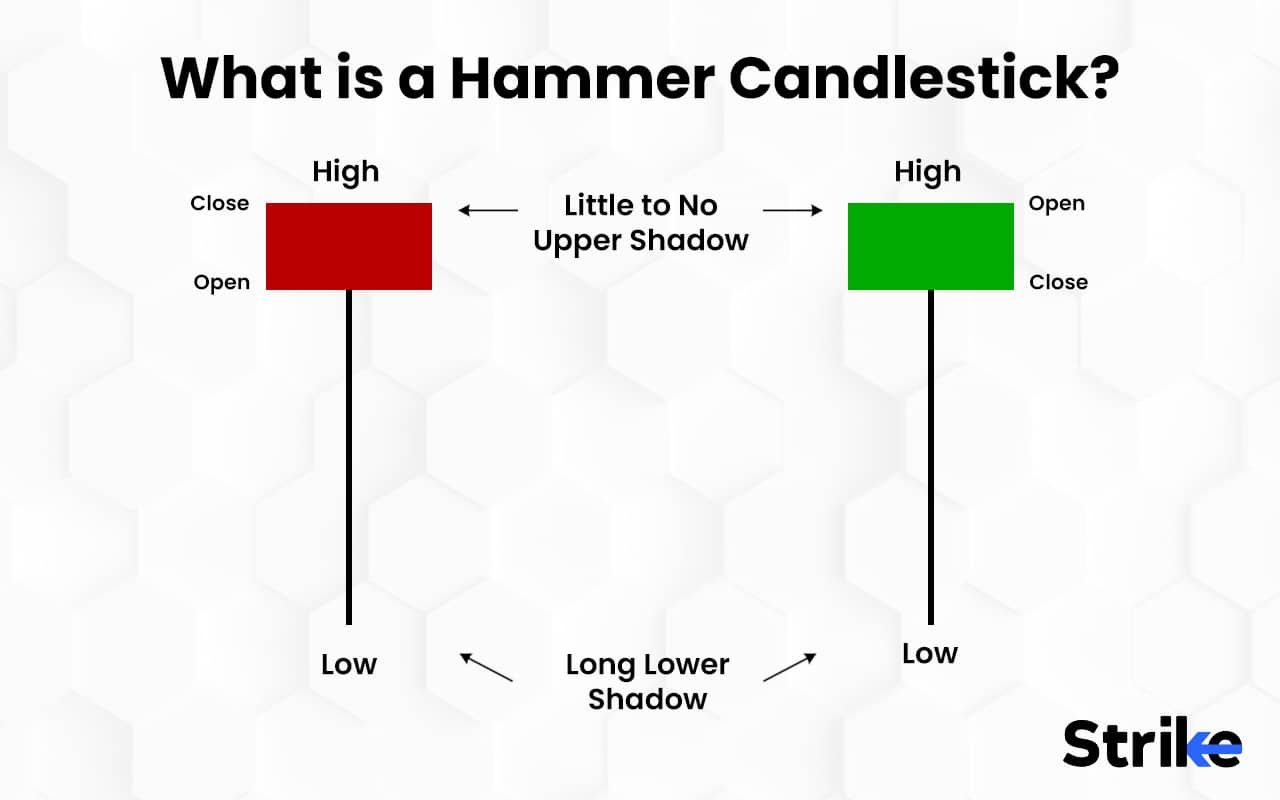
The hammer pattern is a candlestick pattern that signals a potential bullish reversal, primarily found at the bottom of a downtrend. It gets its name from its shape, which resembles a hammer. The candlestick has a small body (either bullish or bearish), a long lower shadow (or wick), and a small or non-existent upper shadow. The length of the lower shadow should be at least twice the length of the body.
The formation of a hammer pattern indicates that during the trading period, the price initially declined significantly, but buyers stepped in and pushed the price back up near the opening price. This shows that the selling pressure is weakening, and buyers are gaining control, potentially leading to a reversal of the downtrend.
Characteristics of a Valid Hammer Pattern
To accurately identify a hammer pattern, it’s essential to understand its key characteristics:
- Preceding Downtrend: The pattern must occur after a noticeable downtrend. This is crucial because the hammer pattern is a reversal signal, and a downtrend provides the context for a potential reversal.
- Small Body: The real body (the distance between the open and close price) should be small. The color of the body (bullish or bearish) is less important, but a bullish body (closing price higher than the opening price) is generally considered a stronger signal.
- Long Lower Shadow: The lower shadow should be at least twice the length of the real body. This long shadow indicates that the price tested lower levels before buyers intervened.
- Small or Non-Existent Upper Shadow: The upper shadow should be small or ideally nonexistent. A significant upper shadow weakens the signal, as it suggests that sellers were still present during the trading period.
Identifying the Hammer Pattern on a Chart
Identifying the hammer pattern on a stock chart requires a keen eye and an understanding of the characteristics mentioned above. Here’s a step-by-step guide:
- Identify a Downtrend: Begin by identifying a period of sustained price decline. The longer and steeper the downtrend, the more significant the potential reversal.
- Look for the Candlestick Shape: Scan the chart for a candlestick with a small body, a long lower shadow, and a small or non-existent upper shadow. Remember that the lower shadow should be at least twice the length of the body.
- Confirm the Pattern: Ensure that the candlestick appears at the bottom of the downtrend. This is a crucial confirmation factor.
- Consider Volume: While not essential, an increase in trading volume during the formation of the hammer pattern can strengthen the signal. High volume suggests strong buying interest.
Trading Strategies Using the Hammer Pattern
Once you’ve identified a valid hammer pattern, you can incorporate it into your trading strategy. Here are a few common approaches:
- Confirmation Candle: Wait for a confirmation candle before entering a trade. A confirmation candle is a bullish candle that closes above the high of the hammer pattern. This provides further evidence that the downtrend has reversed and buyers are in control.
- Stop-Loss Placement: Place your stop-loss order below the low of the hammer pattern. This helps to limit your potential losses if the price continues to decline.
- Profit Target: Set a profit target based on your risk-reward ratio. A common approach is to aim for a profit target that is at least twice the distance between your entry price and your stop-loss price. Consider recent resistance levels as potential profit targets.
- Combine with Other Indicators: Enhance the accuracy of the hammer pattern by combining it with other technical indicators, such as moving averages, Relative Strength Index (RSI), or MACD. [See also: RSI Divergence Trading Strategy]
Examples of Hammer Patterns in Real-World Scenarios
Imagine a stock has been in a steady downtrend for several weeks. Investors are bearish, and selling pressure is high. Suddenly, a hammer pattern appears on the chart. The price initially drops significantly during the trading day, but buyers step in and aggressively push the price back up, closing near the opening price. This hammer pattern suggests that the selling pressure is waning, and buyers are gaining control. Traders who recognize this pattern might consider entering a long position, anticipating a potential reversal of the downtrend.
Another scenario involves a stock that has been consolidating near a support level after a prolonged downtrend. A hammer pattern forms near this support level, further reinforcing the potential for a bullish reversal. The combination of the support level and the hammer pattern provides a strong signal for traders to consider entering a long position. They would likely place their stop-loss order slightly below the support level to protect against further downside risk.
Limitations of the Hammer Pattern
While the hammer pattern can be a valuable tool, it’s important to understand its limitations:
- False Signals: Like all technical indicators, the hammer pattern can generate false signals. The price may not always reverse after the formation of a hammer pattern.
- Subjectivity: Identifying the hammer pattern can be subjective. Different traders may interpret the pattern differently, especially when the characteristics are not perfectly aligned.
- Lack of Context: The hammer pattern should not be used in isolation. It’s essential to consider the overall market context and other technical indicators to confirm the signal.
Combining the Hammer Pattern with Other Indicators
To improve the accuracy of the hammer pattern, consider combining it with other technical indicators:
- Moving Averages: Look for the hammer pattern to form near a key moving average, such as the 50-day or 200-day moving average. This can provide additional support for the potential reversal. [See also: Understanding Moving Averages in Stock Trading]
- Relative Strength Index (RSI): Use the RSI to confirm oversold conditions. If the RSI is below 30 when the hammer pattern forms, it suggests that the stock is oversold and a reversal is more likely.
- MACD: Look for a bullish crossover in the MACD indicator to confirm the potential reversal. A bullish crossover occurs when the MACD line crosses above the signal line.
- Volume Analysis: Observe the trading volume during the formation of the hammer pattern. A significant increase in volume can indicate strong buying interest and strengthen the signal.
Psychology Behind the Hammer Pattern
Understanding the psychology behind the hammer pattern can provide valuable insights into market sentiment. The long lower shadow represents a battle between buyers and sellers. Initially, sellers dominate, pushing the price down to new lows. However, buyers then step in and aggressively push the price back up, closing near the opening price. This indicates a shift in market sentiment from bearish to bullish. The hammer pattern reflects the resilience of buyers and their willingness to defend against further price declines.
Inverted Hammer Pattern
It’s important to note the existence of a similar pattern called the inverted hammer pattern. The inverted hammer is a bullish reversal pattern that occurs at the bottom of a downtrend. It looks like an upside-down hammer, with a long upper shadow and a small or non-existent lower shadow. While both patterns signal potential bullish reversals, their formations differ slightly. The inverted hammer’s long upper shadow suggests that buyers attempted to push the price higher, but sellers managed to push it back down. However, the fact that buyers were able to push the price up at all indicates a potential shift in momentum.
Conclusion
The hammer pattern is a valuable tool for traders looking to identify potential bullish reversals in stock trading. By understanding its characteristics, identifying it accurately on a chart, and combining it with other technical indicators, traders can enhance their trading strategies and improve their chances of success. Remember to always consider the limitations of the hammer pattern and use it in conjunction with other forms of analysis to make informed trading decisions. Proper risk management, including stop-loss orders, is essential when trading any pattern, including the hammer pattern.
